S&P 500 7,473.47 (+0.4%) · 10Y Treasury Yield 4.56% (-3bps) · Gold $4,510.50 ($-29.30 (-0.6%)) · VIX 16.70 (-0.4%)
Subscribe
·
How It Works
·
Archive

Daily Market Brief
Friday, May 22nd, 2026
The 56 Maple Daily Brief is a curated macro and markets summary built for private equity investors and operators.
It tracks 40+ key indicators across rates, credit, equities, currencies, commodities, flows, and real estate. Highlighting what moved and why.
Delivered each day with AI-powered interpretation and relevant analysis via the lastest Anthropic Model.
10Y Treasury Yield
4.56%
-3bps
Crude Oil (WTI)
$97.00
+$0.65 (+0.7%)
Gold
$4,510.50
$-29.30 (-0.6%)
Macro Interpretation
AI-generated synthesis · claude-sonnet-4-20250514 · Friday, May 22nd, 2026
Bonds
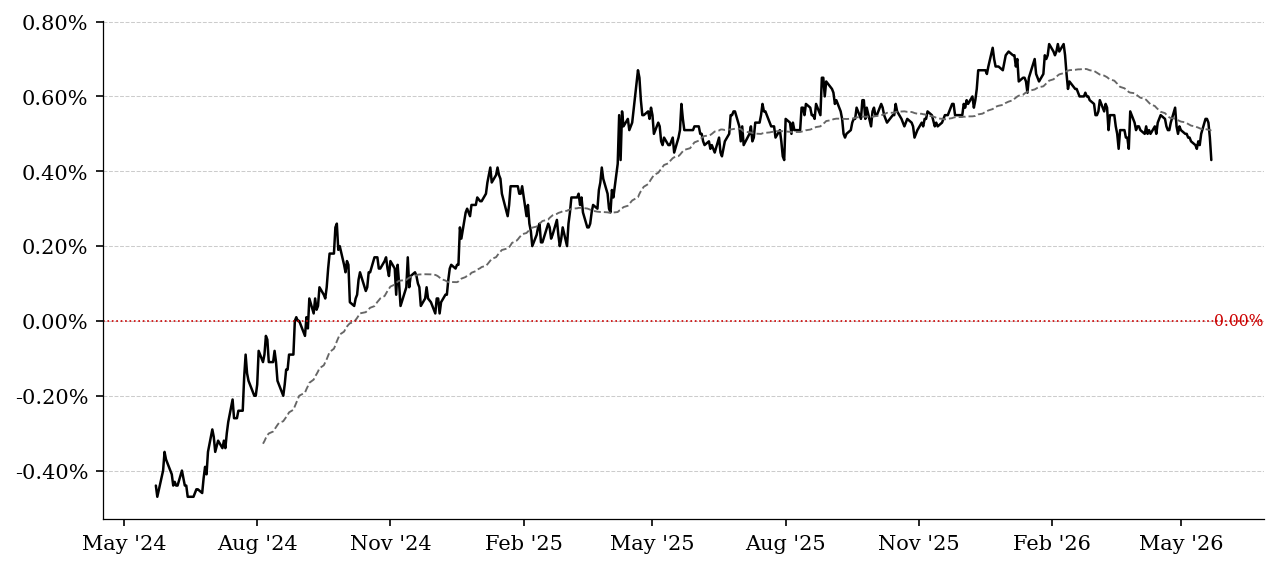
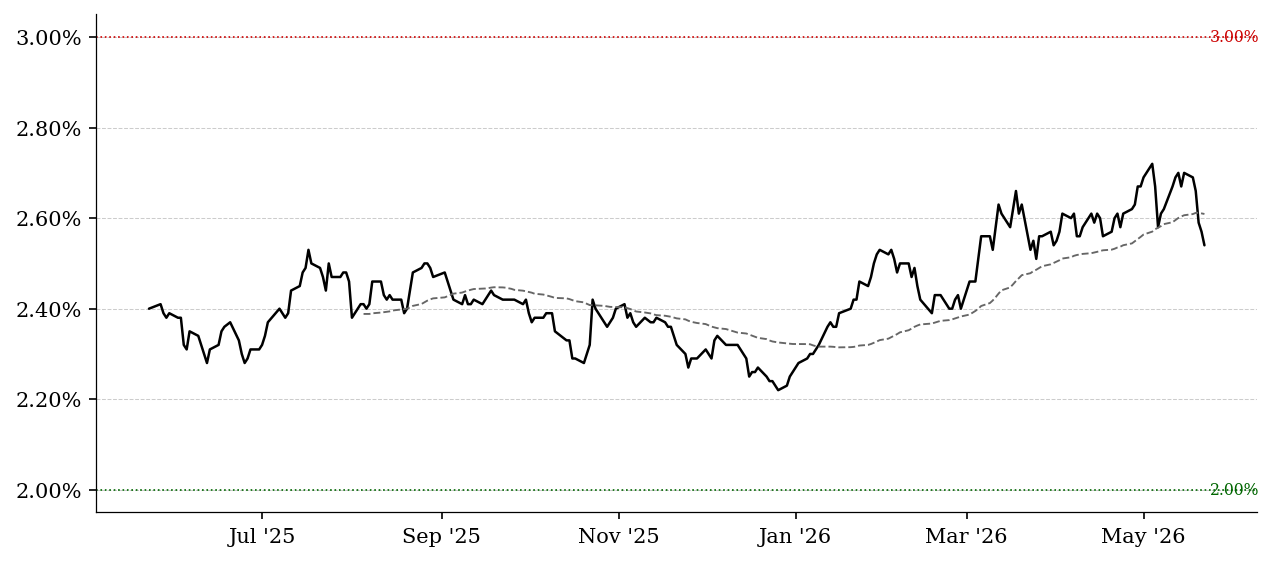
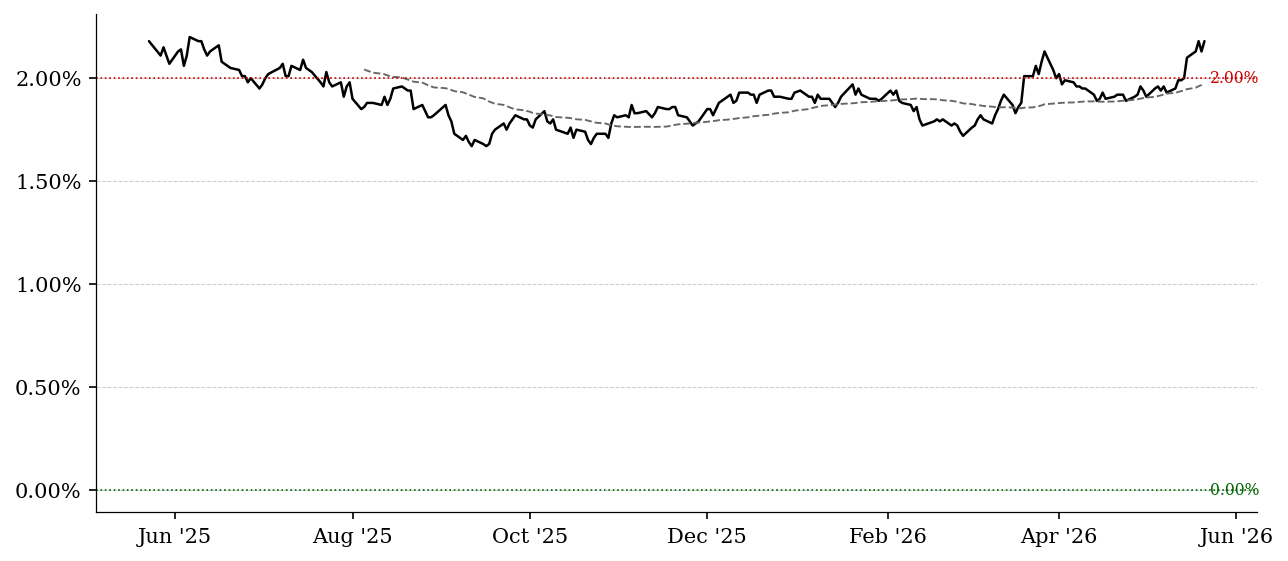
The 10Y yield fell 4 bps this week to 4.56% while the 30Y dropped sharply, flattening the long end as breakeven inflation expectations declined 36 bps on the 10Y. Real rates jumped 9% on the week, indicating the market is pricing out near-term inflation concerns while maintaining higher terminal rate expectations. The curve steepened slightly with 2s10s at 43 bps, but the overall bond rally suggests growing confidence in disinflation. Conviction: MODERATE.
Credit
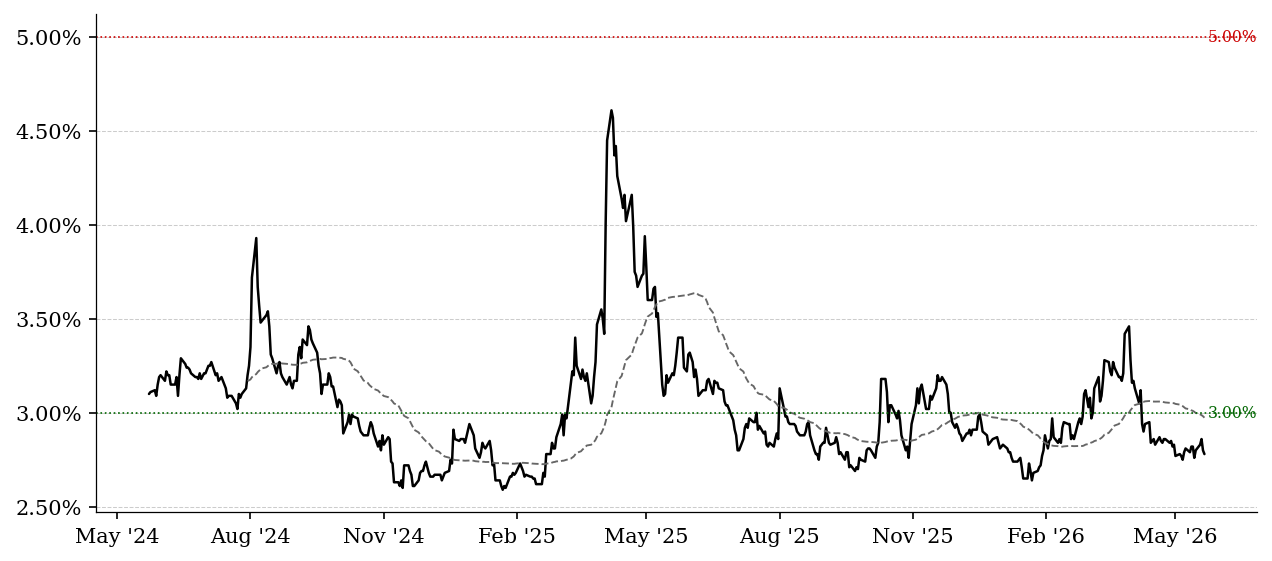
HY spreads widened marginally to 2.78% while HYG gained 0.6% on the week, indicating solid risk appetite despite rate volatility. The modest spread widening appears technical rather than fundamental, with credit continuing to outperform duration risk in Treasuries. IG bonds followed suit with LQD up 0.5% weekly. Conviction: LOW.
Private Credit
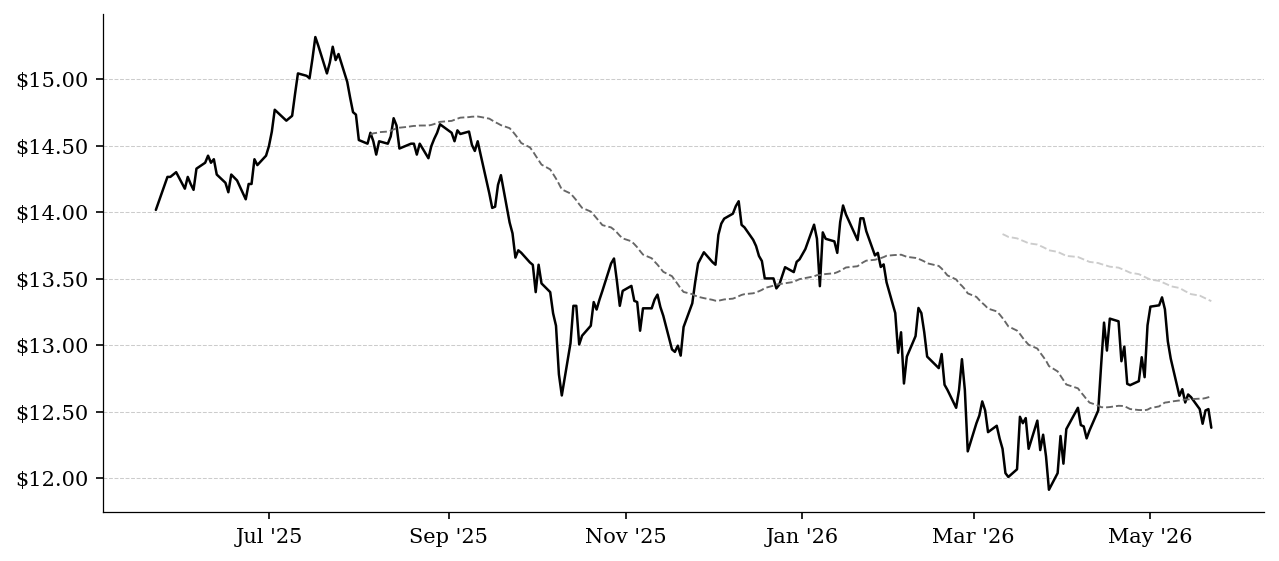
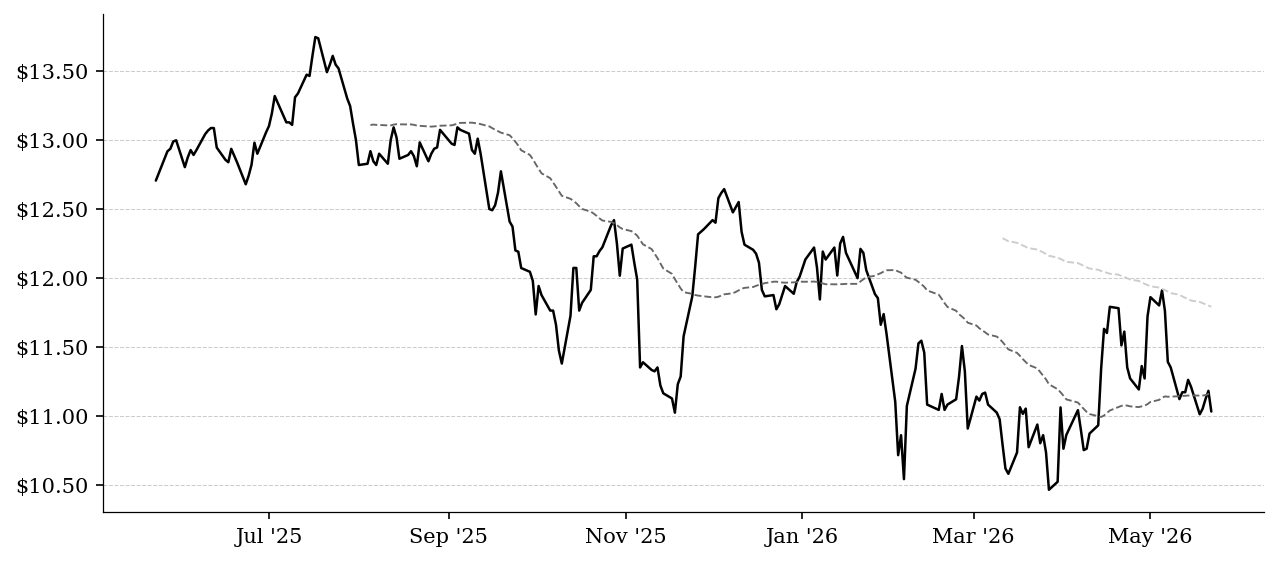
BIZD fell 1.8% this week while BKLN declined only 0.2%, with SRLN essentially flat, creating a notable divergence between BDC equity performance and underlying loan markets. OBDC dropped 1.6% weekly to $11.03, extending its year-to-date decline to over 9%, suggesting investors are pricing in deteriorating credit conditions in direct lending that haven't yet materialized in floating-rate loan indices. The HYG/LQD ratio remained stable, indicating no broad credit stress, making the BDC weakness more idiosyncratic to private credit fundamentals. Conviction: MODERATE.
Equities
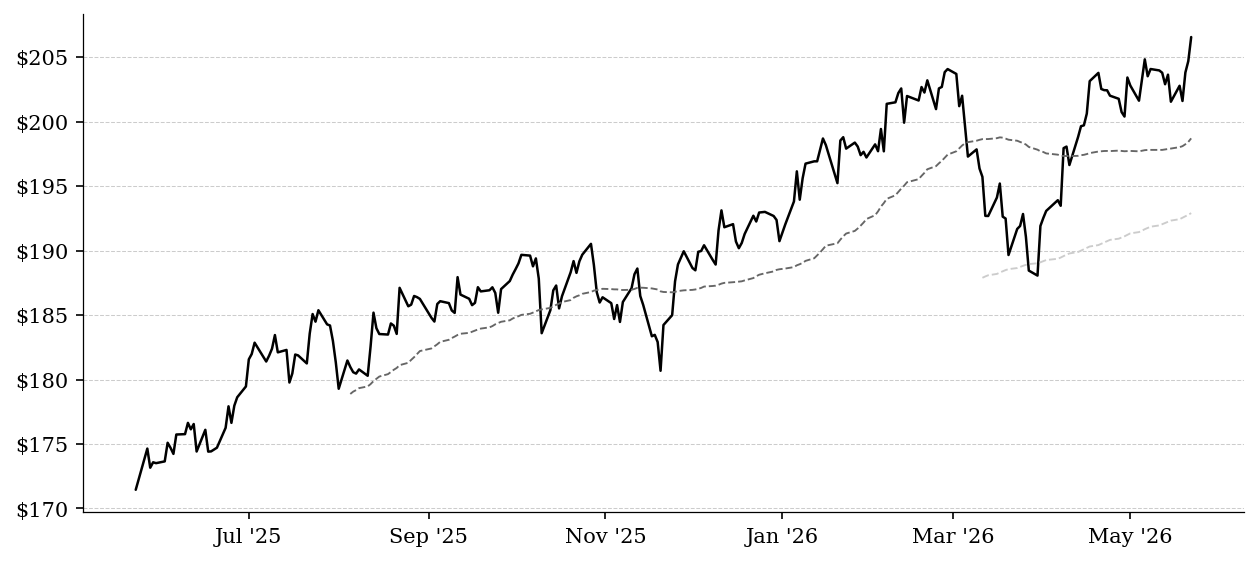
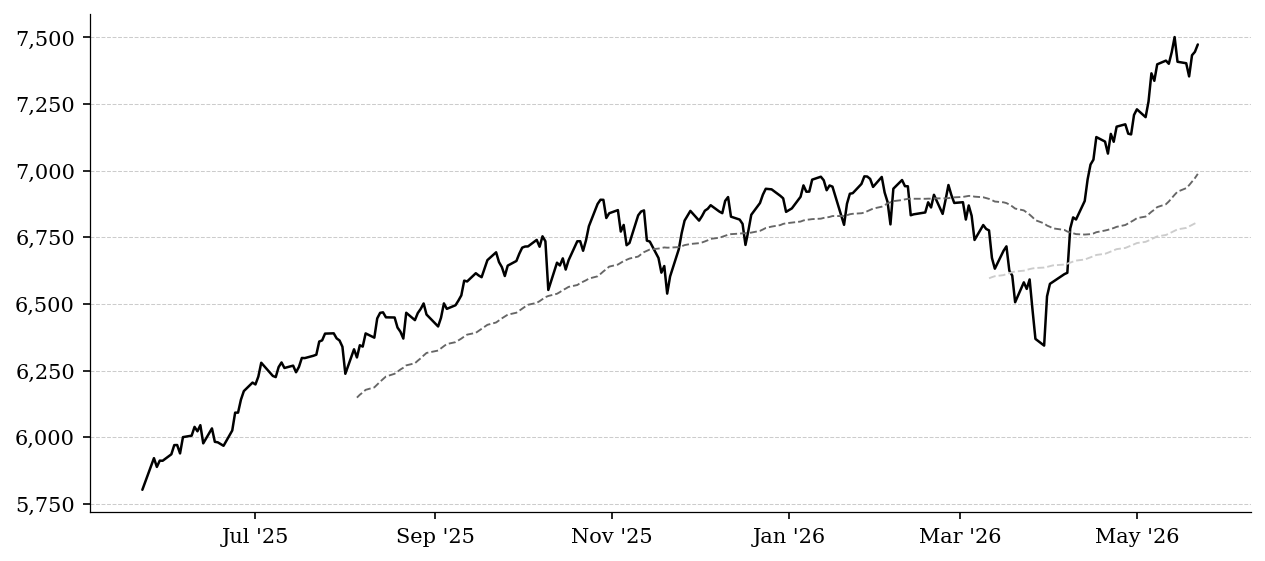
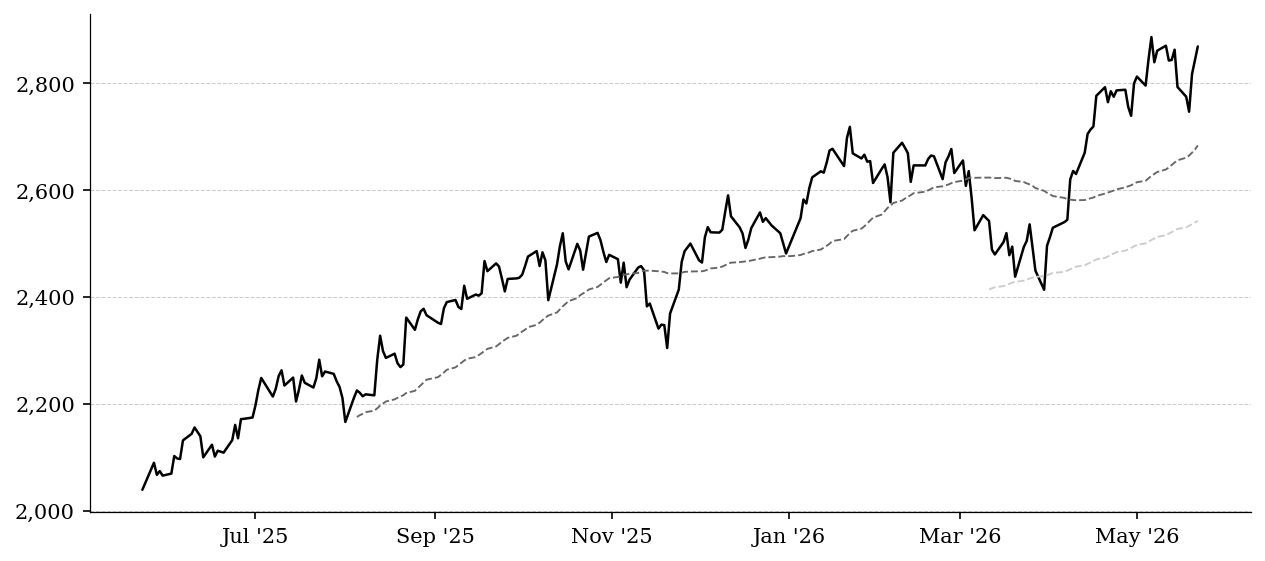
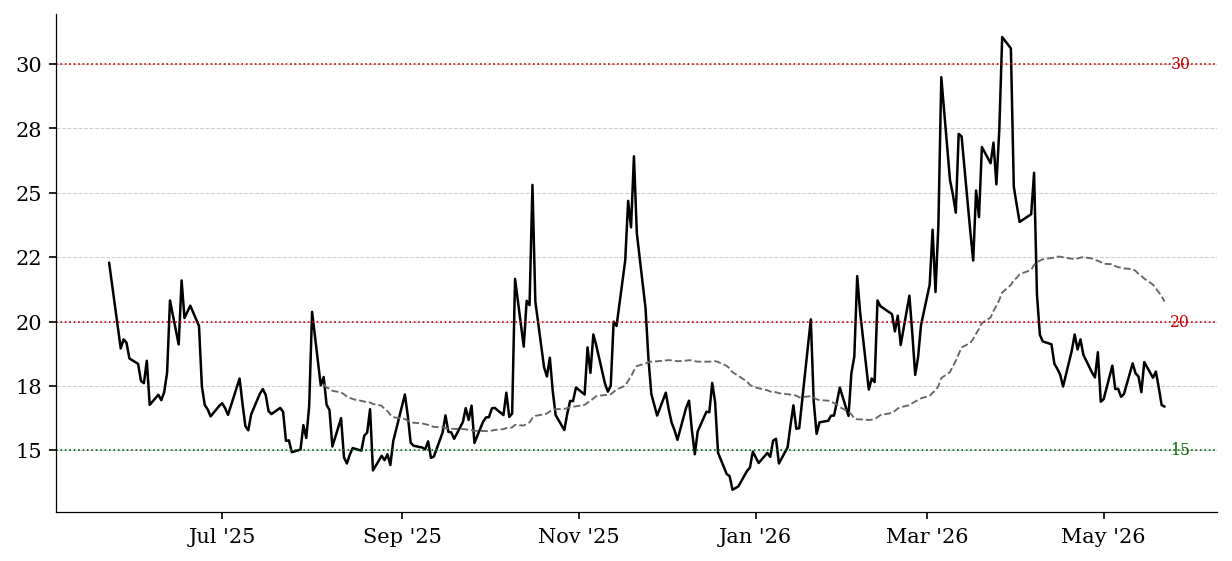
Broad equity strength continued with the S&P 500 up 0.9% weekly while equal-weight RSP surged 2.5%, indicating healthy market breadth. Small caps led with Russell 2000 gaining 2.7% as the VIX fell to 16.7, down 9.4% on the week. The outperformance of equal-weight and small caps suggests risk appetite is broadening beyond mega-cap leadership. Conviction: HIGH.
Commodities
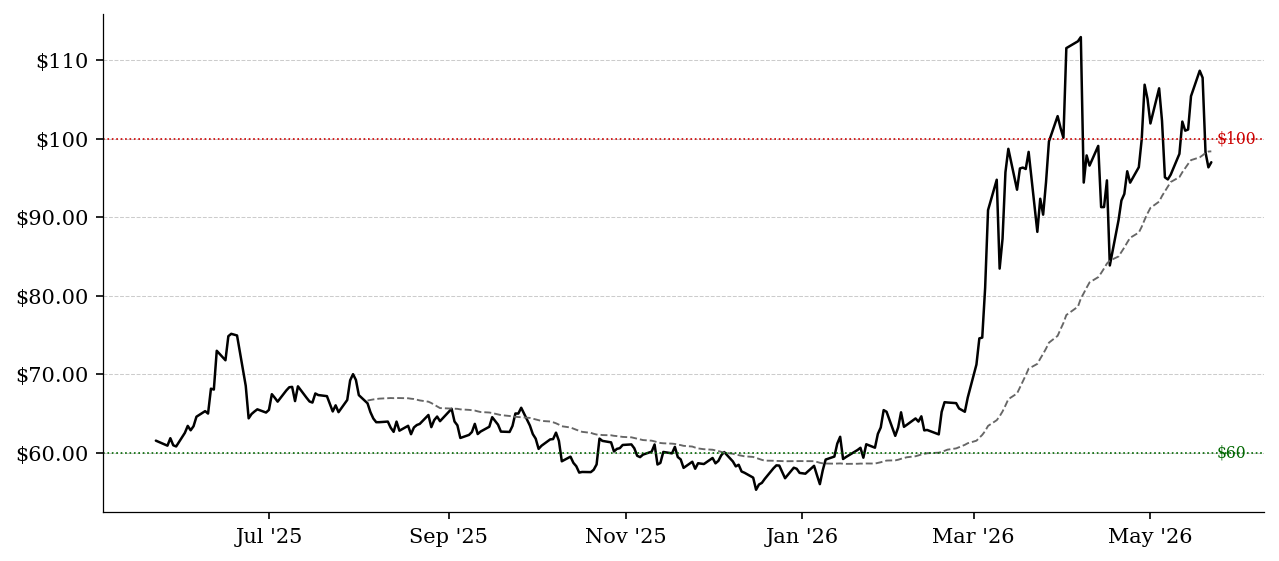
Oil fell sharply 8% this week to $97 despite year-to-date gains of 69%, while copper rose 2.1% and agricultural commodities showed strength with soybeans and wheat both up over 1.7%. The oil decline appears to be profit-taking rather than demand destruction, given the continued strength in industrial metals and grains. Conviction: MODERATE.
Today's Environment
This environment shows Risk-on characteristics with falling yields, rising equities with broad participation, and stable credit spreads. The combination of disinflation expectations, equity breadth expansion, and contained credit risk suggests markets are pricing a soft landing scenario.
Practical Investment Implications
Small caps and equal-weight strategies are favored given the broadening market participation, while private credit BDCs may face continued headwinds as investors price in cycle deterioration ahead of fundamentals. Duration strategies benefit from the disinflation trade, particularly in the long end where real rates have reset higher.
One Key Change to Watch
A reversal in breakeven inflation expectations back above 2.6% would challenge the current soft landing narrative and pressure both bonds and risk assets.
Bonds
2Y Treasury Yield
^IRX
· YAHOO
· Daily
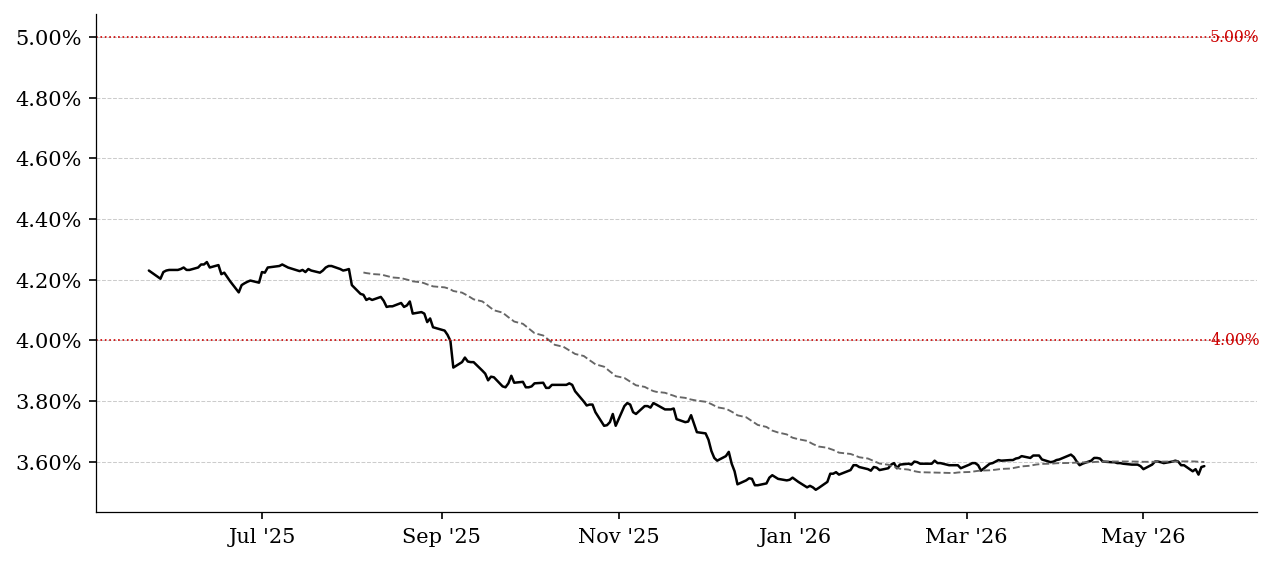
| Current |
1 Day |
1 Week |
1 Month |
YTD |
| 3.58% |
+0bps |
-0bps |
-1bps |
+5bps |
As of May 22, 2026
Yield on short-term U.S. government debt, primarily driven by expectations for Federal Reserve policy over the next 1-2 years.
This is the market's real-time view of where the Fed is headed; when it rises, the market is pricing tighter policy or delayed cuts, and when it falls, it reflects expectations of easing or economic slowdown, making it one of the most important forward-looking policy indicators.
5Y Treasury Yield
^FVX
· YAHOO
· Daily
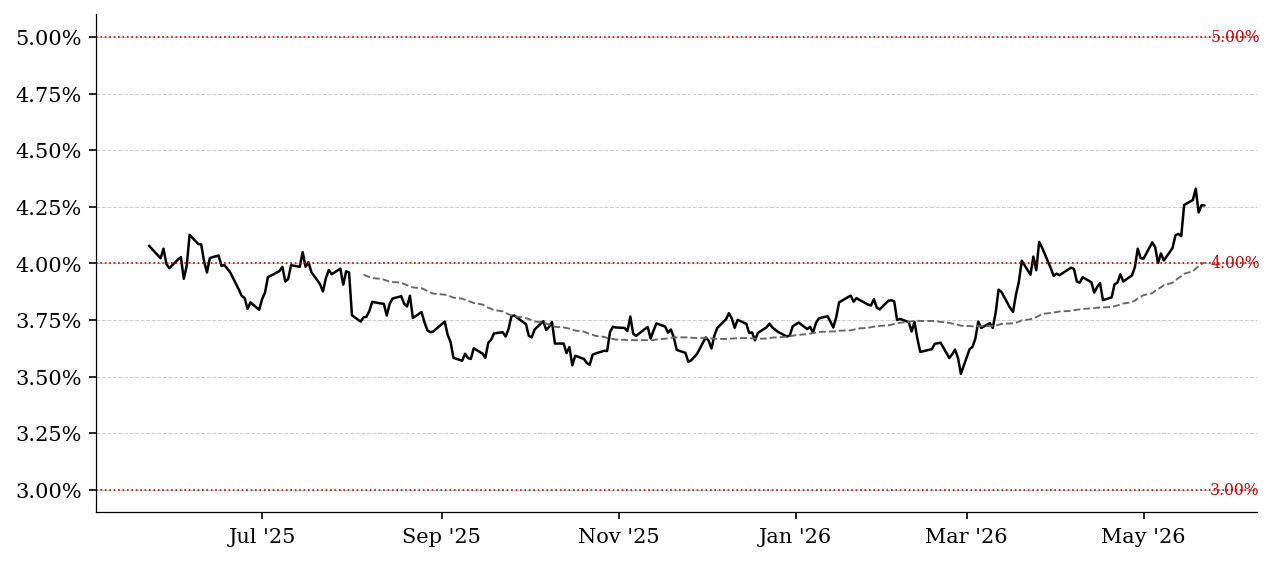
| Current |
1 Day |
1 Week |
1 Month |
YTD |
| 4.26% |
-0bps |
-0bps |
+30bps |
+52bps |
As of May 22, 2026
Intermediate-term Treasury yield that reflects both expected Fed policy and medium-term economic conditions.
This sits between short-term policy and long-term growth expectations, so changes here often signal a shift in the market's base-case economic outlook rather than just near-term Fed moves.
10Y Treasury Yield
^TNX
· YAHOO
· Daily
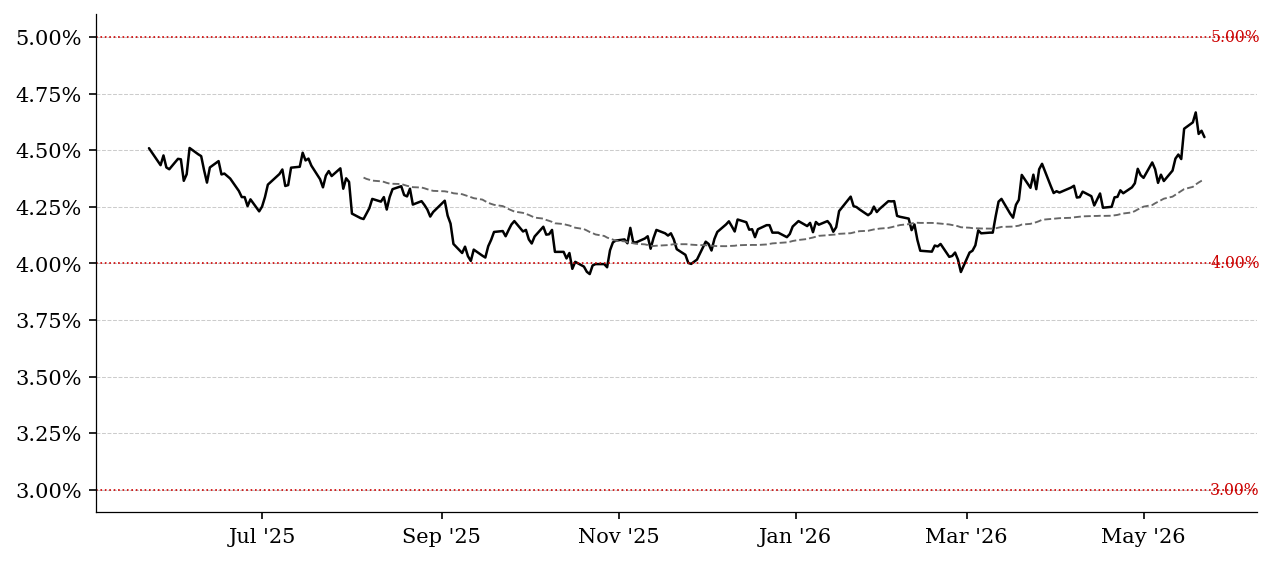
| Current |
1 Day |
1 Week |
1 Month |
YTD |
| 4.56% |
-3bps |
-4bps |
+24bps |
+37bps |
As of May 22, 2026
Benchmark long-term interest rate reflecting expectations for growth, inflation, and risk over a full economic cycle.
This is the most important rate for asset pricing; rising yields generally indicate stronger growth or higher inflation expectations and tighten financial conditions, while falling yields signal slowing growth, disinflation, or risk aversion, directly impacting valuations across equities and real estate.
30Y Treasury Yield
^TYX
· YAHOO
· Daily
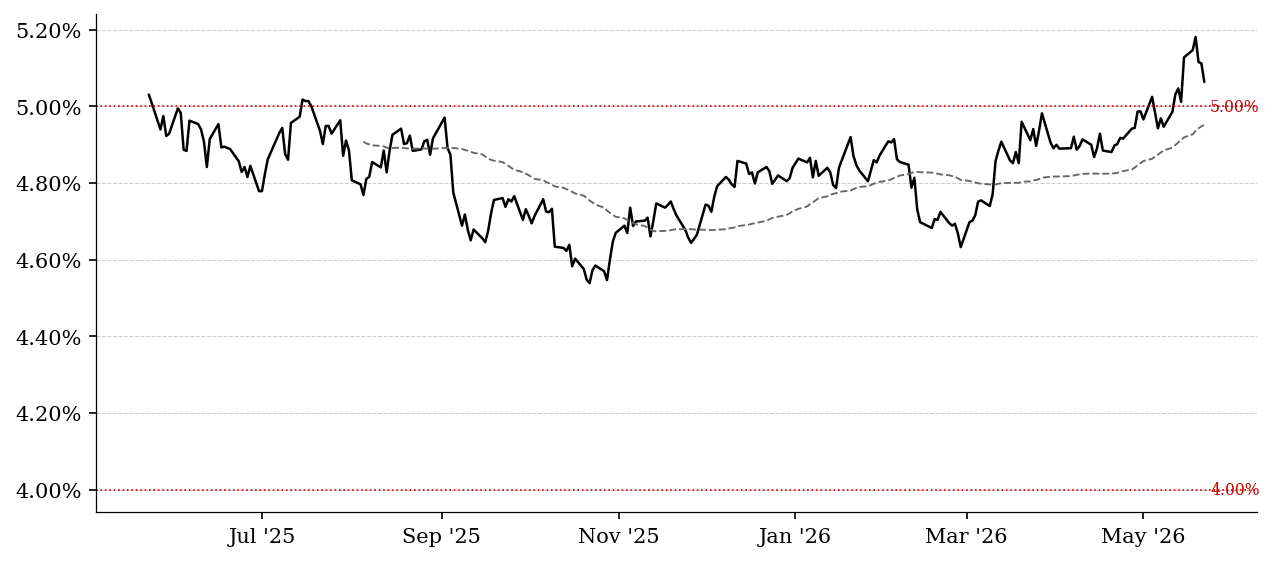
| Current |
1 Day |
1 Week |
1 Month |
YTD |
| 5.06% |
-0.9% |
-1.2% |
+3.0% |
+4.1% |
As of May 22, 2026
Long-duration yield reflecting long-term economic expectations, inflation risk, and fiscal sustainability.
Movements here are less about near-term cycles and more about structural views on inflation and government debt, making it particularly relevant for long-duration assets and understanding long-term capital costs.
20+ Year Treasury Bond ETF
TLT
· YAHOO
· Daily
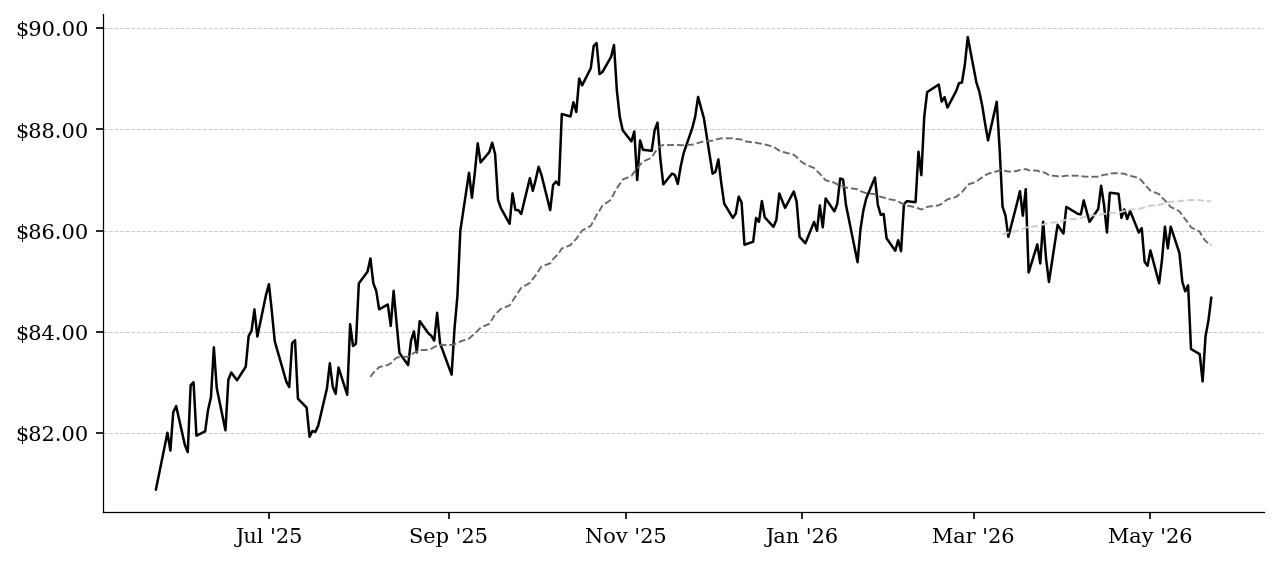
| Current |
1 Day |
1 Week |
1 Month |
YTD |
| $84.68 |
+$0.46 (+0.5%) |
+$1.02 (+1.2%) |
$-1.55 (-1.8%) |
$-1.07 (-1.2%) |
As of May 22, 2026
ETF representing long-duration U.S. Treasury bonds, inversely related to long-term yields.
This acts as a real-time proxy for long-duration risk; when TLT falls, it indicates rising long-term rates and tightening financial conditions, and when it rises, it reflects declining yields and easing conditions, often coinciding with risk-off environments.
High Yield Corporate Bond ETF
HYG
· YAHOO
· Daily
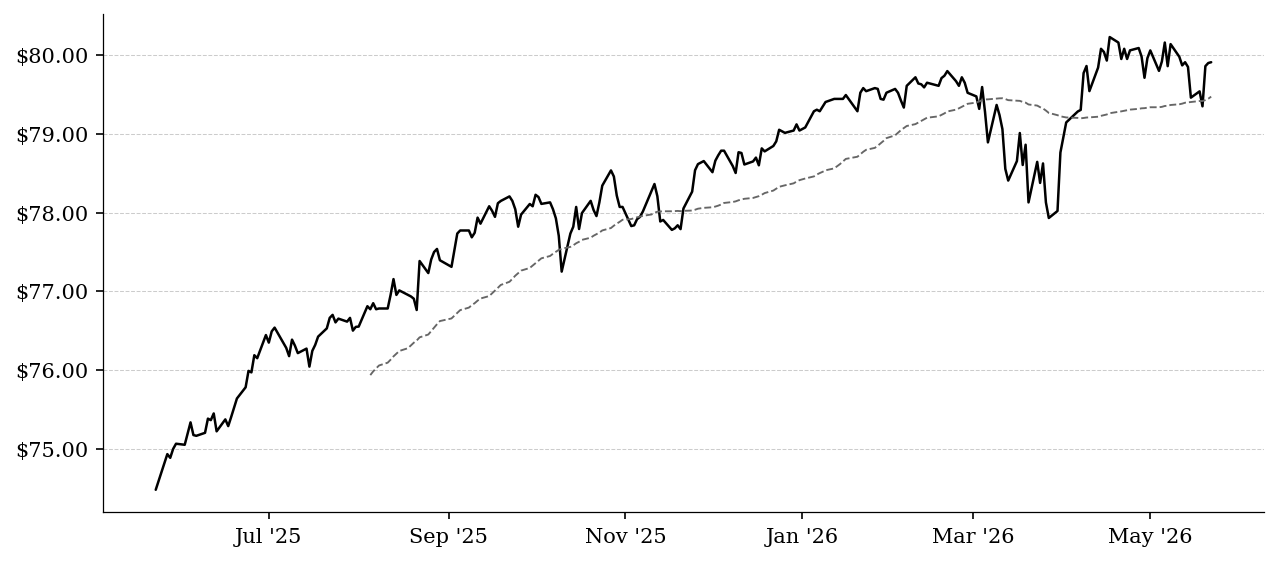
| Current |
1 Day |
1 Week |
1 Month |
YTD |
| $79.91 |
+$0.01 (+0.0%) |
+$0.45 (+0.6%) |
$-0.04 (-0.1%) |
+$0.83 (+1.0%) |
As of May 22, 2026
ETF representing below-investment-grade corporate debt, combining credit risk and interest rate exposure.
This is a key proxy for credit risk appetite; rising prices suggest easy financial conditions and strong risk tolerance, while falling prices indicate widening credit spreads and increasing concern about defaults or economic stress.
Investment Grade Corporate Bond ETF
LQD
· YAHOO
· Daily
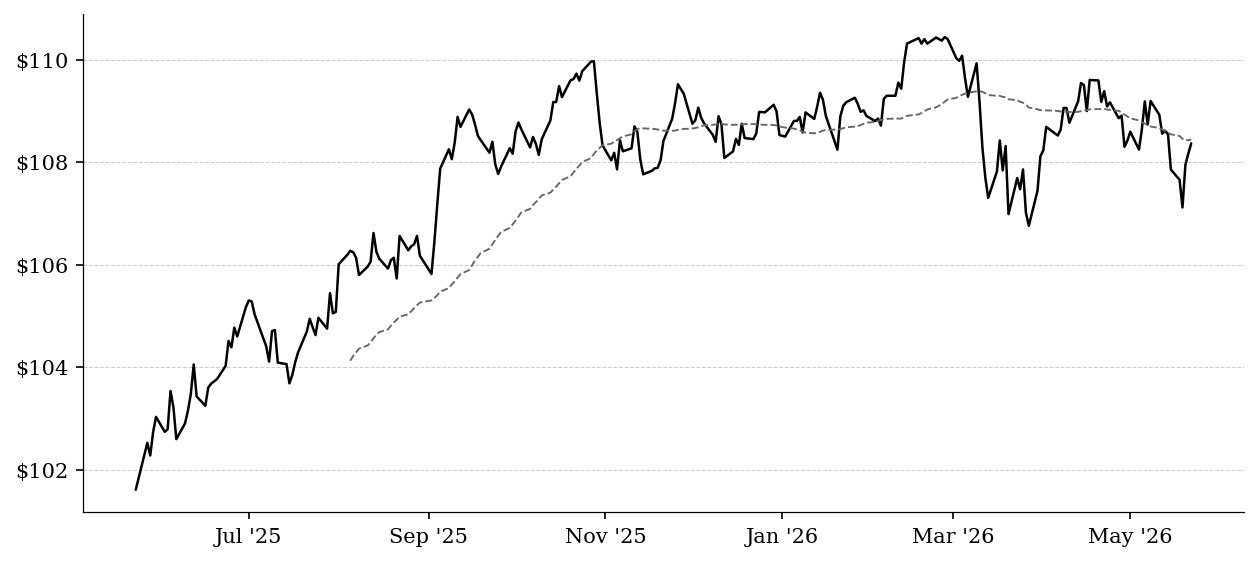
| Current |
1 Day |
1 Week |
1 Month |
YTD |
| $108.37 |
+$0.20 (+0.2%) |
+$0.51 (+0.5%) |
$-0.72 (-0.7%) |
$-0.13 (-0.1%) |
As of May 22, 2026
ETF representing high-quality corporate bonds with lower credit risk than high yield.
This reflects both interest rate movements and corporate credit quality; weakness here can signal tightening financial conditions even before equity markets react, particularly if driven by spread widening rather than rates.
Fed Funds Effective Rate
DFF
· FRED
· Daily
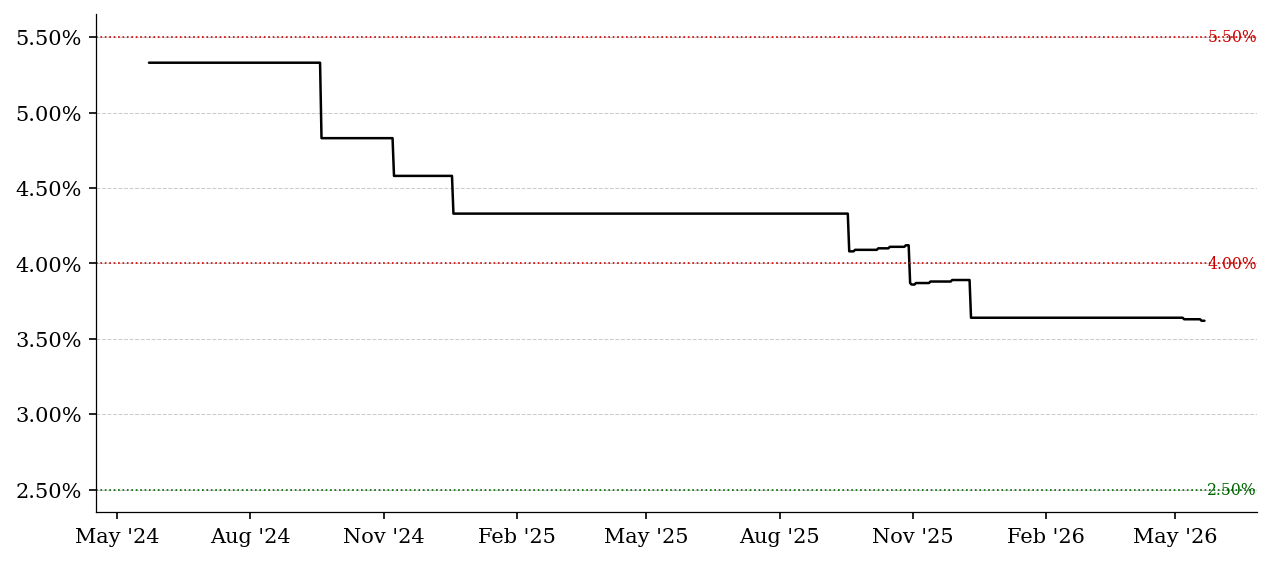
| Current |
1 Day |
1 Week |
1 Month |
YTD |
| 3.62% |
+0.0% |
-0.3% |
-0.5% |
-0.5% |
As of May 21, 2026
The actual overnight rate at which banks lend reserves to each other, reflecting current Fed policy.
This is the anchor of the entire rate system; changes here directly influence borrowing costs across the economy and serve as the baseline against which all other yields are evaluated.
2s10s Yield Curve Spread
T10Y2Y
· FRED
· Daily
| Current |
1 Day |
1 Week |
1 Month |
YTD |
| 0.43% |
-12.2% |
-14.0% |
-15.7% |
-40.3% |
As of May 22, 2026
Difference between 10-year and 2-year Treasury yields, measuring the slope of the yield curve.
This is a core economic signal; an inverted curve (negative spread) suggests restrictive policy and elevated recession risk, while a steepening curve typically reflects either improving growth expectations or easing financial conditions.
5Y Breakeven Inflation
T5YIE
· FRED
· Daily
| Current |
1 Day |
1 Week |
1 Month |
YTD |
| 2.54% |
-1.2% |
-5.9% |
-1.6% |
+11.4% |
As of May 22, 2026
Market-implied average inflation over the next 5 years derived from nominal vs TIPS yields.
This reflects near-to-medium-term inflation expectations; rising breakevens indicate increasing inflation expectations, while falling breakevens suggest disinflation or weakening demand.
10Y Breakeven Inflation
T10YIE
· FRED
· Daily
| Current |
1 Day |
1 Week |
1 Month |
YTD |
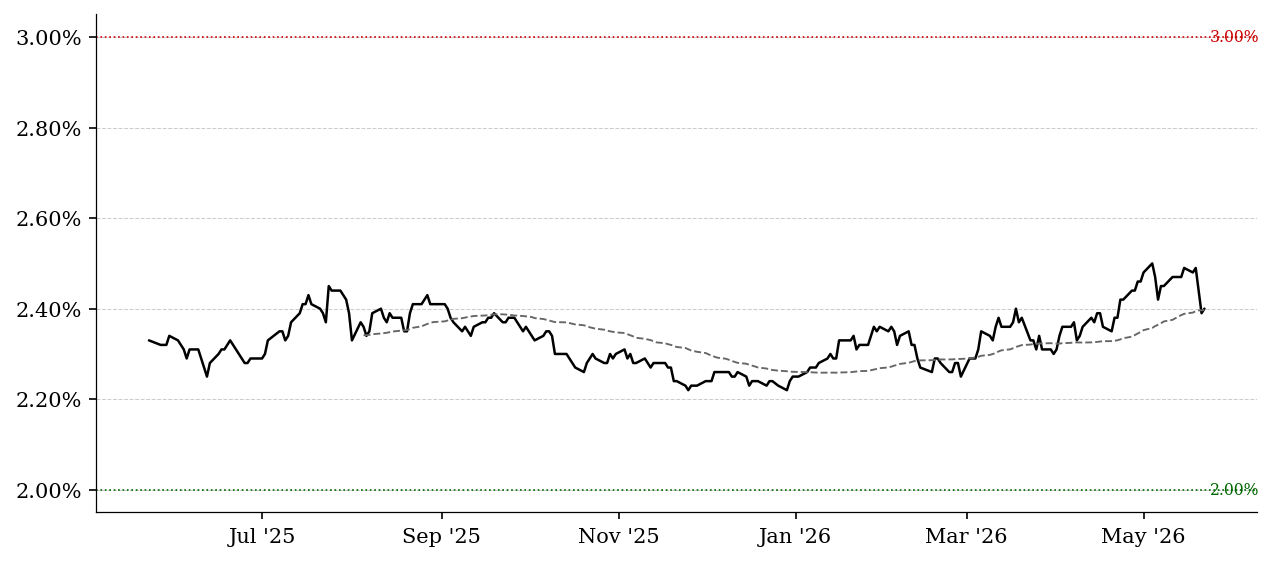
| 2.40% |
+0.4% |
-3.6% |
-0.8% |
+6.7% |
As of May 22, 2026
Market-implied inflation expectations over the next 10 years.
This provides a longer-term view of inflation credibility; stable levels suggest anchored expectations, while large moves signal shifts in confidence around long-term price stability.
10Y Real Rate (TIPS)
DFII10
· FRED
· Daily
| Current |
1 Day |
1 Week |
1 Month |
YTD |
| 2.18% |
+2.3% |
+9.0% |
+13.5% |
+12.4% |
As of May 21, 2026
Inflation-adjusted yield on 10-year Treasuries, representing the real cost of capital.
This is one of the most important variables for asset valuation; rising real rates tighten financial conditions and pressure risk assets, while falling real rates support higher valuations and economic activity.
ICE BofA US High Yield Spread
BAMLH0A0HYM2
· FRED
· Daily
| Current |
1 Day |
1 Week |
1 Month |
YTD |
| 2.78% |
-0.7% |
+0.7% |
-2.1% |
-1.8% |
As of May 21, 2026
Option-adjusted spread of US high yield corporate bonds over Treasuries.
The price of credit risk. Below 3% = euphoria, risk underpriced. 3-5% = normal. Above 5% = stress building. Above 8% = crisis-level credit distress.
US Equities
S&P 500 Equal Weight
RSP
· YAHOO
· Daily
| Current |
1 Day |
1 Week |
1 Month |
YTD |
| $206.58 |
+$1.87 (+0.9%) |
+$5.02 (+2.5%) |
+$4.13 (+2.0%) |
+$14.54 (+7.6%) |
As of May 22, 2026
Equal-weighted version of the S&P 500, removing concentration in mega-cap stocks.
This helps assess market breadth; if it lags the standard index, it indicates narrow leadership, while outperformance signals broad participation across stocks.
Financial Select Sector SPDR
XLF
· YAHOO
· Daily
| Current |
1 Day |
1 Week |
1 Month |
YTD |
| $51.94 |
+$0.21 (+0.4%) |
+$0.84 (+1.6%) |
+$0.14 (+0.3%) |
$-2.71 (-5.0%) |
As of May 22, 2026
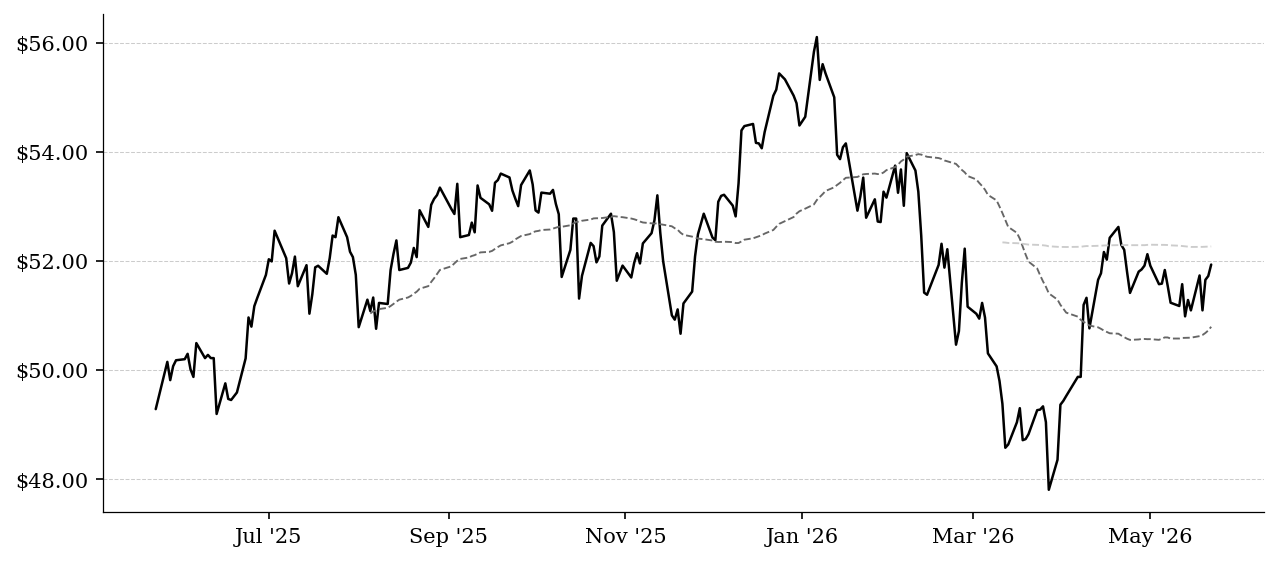
ETF tracking U.S. financial institutions including banks and insurers.
Financials are highly sensitive to rates and credit conditions; strength suggests healthy lending and economic expansion, while weakness can signal tightening credit or stress in the financial system.
S&P 500
^GSPC
· YAHOO
· Daily
| Current |
1 Day |
1 Week |
1 Month |
YTD |
| 7,473.47 |
+0.4% |
+0.9% |
+5.1% |
+9.0% |
As of May 22, 2026
Market-cap-weighted index of 500 large U.S. companies.
This is the primary benchmark for U.S. equities; movements reflect a combination of earnings expectations, interest rates, and risk appetite, making it a broad indicator of financial conditions.
Nasdaq Composite
^IXIC
· YAHOO
· Daily
| Current |
1 Day |
1 Week |
1 Month |
YTD |
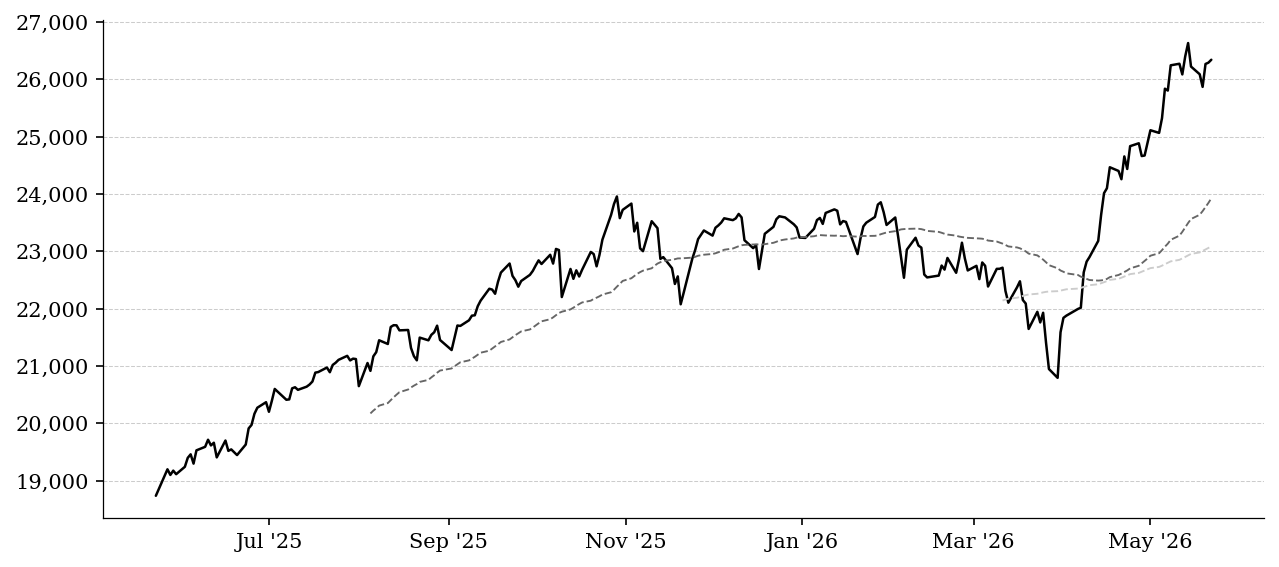
| 26,343.97 |
+0.2% |
+0.5% |
+7.8% |
+13.4% |
As of May 22, 2026
Index heavily weighted toward technology and growth-oriented companies.
This is highly sensitive to interest rates and liquidity; outperformance typically signals strong risk appetite and falling discount rates, while underperformance often reflects tightening conditions.
Dow Jones Industrial Average
^DJI
· YAHOO
· Daily
| Current |
1 Day |
1 Week |
1 Month |
YTD |
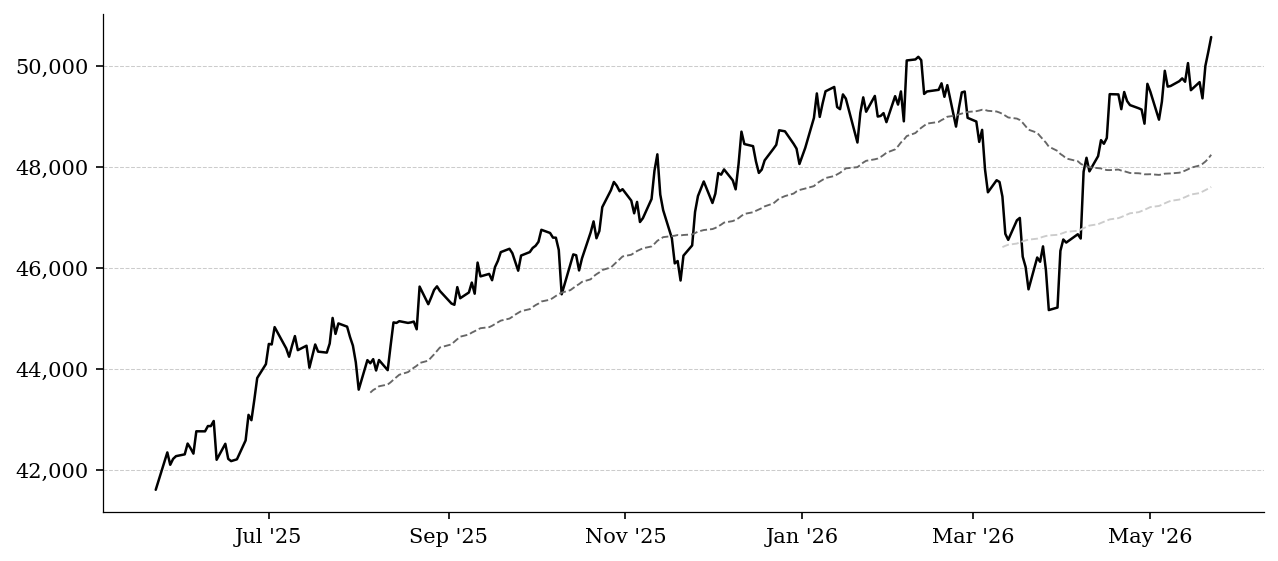
| 50,579.70 |
+0.6% |
+2.1% |
+2.6% |
+4.5% |
As of May 22, 2026
Price-weighted index of 30 large, established U.S. companies.
This tends to reflect more traditional, cyclical sectors and can provide a view into industrial and economic sensitivity relative to growth-heavy indices.
Russell 2000
^RUT
· YAHOO
· Daily
| Current |
1 Day |
1 Week |
1 Month |
YTD |
| 2,869.23 |
+0.9% |
+2.7% |
+3.4% |
+14.4% |
As of May 22, 2026
Index of small-cap U.S. companies.
This is a proxy for domestic economic strength and credit sensitivity; outperformance suggests strong growth and easy financial conditions, while weakness indicates stress in smaller, more leveraged businesses.
VIX
^VIX
· YAHOO
· Daily
| Current |
1 Day |
1 Week |
1 Month |
YTD |
| 16.70 |
-0.4% |
-9.4% |
-13.5% |
+15.1% |
As of May 22, 2026
Implied volatility of S&P 500 options, often called the "fear index."
Elevated levels indicate market stress and uncertainty, while low levels suggest complacency and stable conditions, making it a key barometer of risk sentiment.
Currencies & Gold
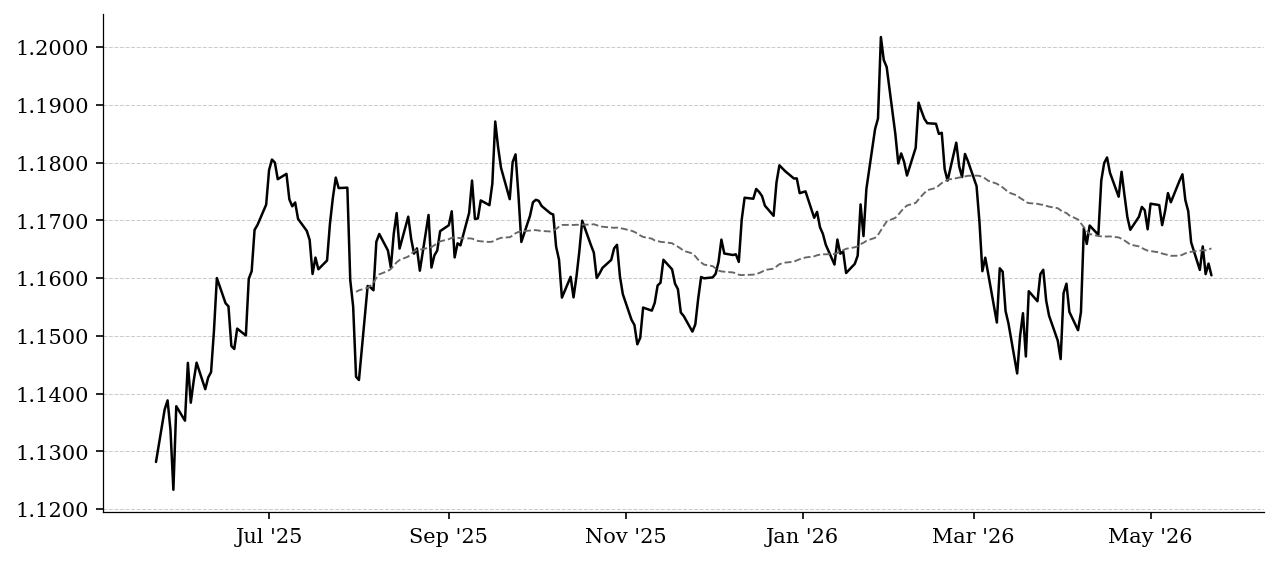
EUR/USD
EURUSD=X
· YAHOO
· Daily
| Current |
1 Day |
1 Week |
1 Month |
YTD |
| 1.1605 |
-0.2% |
-0.5% |
-0.9% |
-1.2% |
As of May 22, 2026
Exchange rate between the euro and U.S. dollar.
Reflects relative economic strength and monetary policy between the U.S. and Europe, often serving as a proxy for global macro positioning.
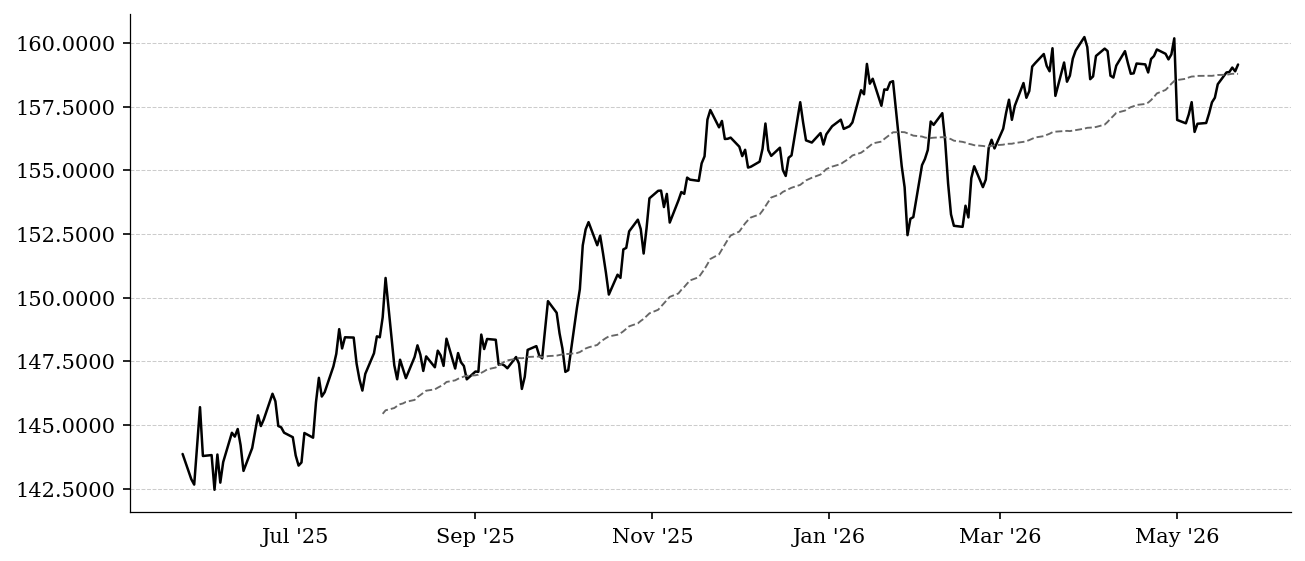
USD/JPY
JPY=X
· YAHOO
· Daily
| Current |
1 Day |
1 Week |
1 Month |
YTD |
| 159.1550 |
+0.2% |
+0.5% |
-0.2% |
+1.5% |
As of May 22, 2026
Exchange rate between the U.S. dollar and Japanese yen.
Highly sensitive to interest rate differentials; a rising pair typically reflects higher U.S. yields and global carry trades, while declines often occur during risk-off periods.
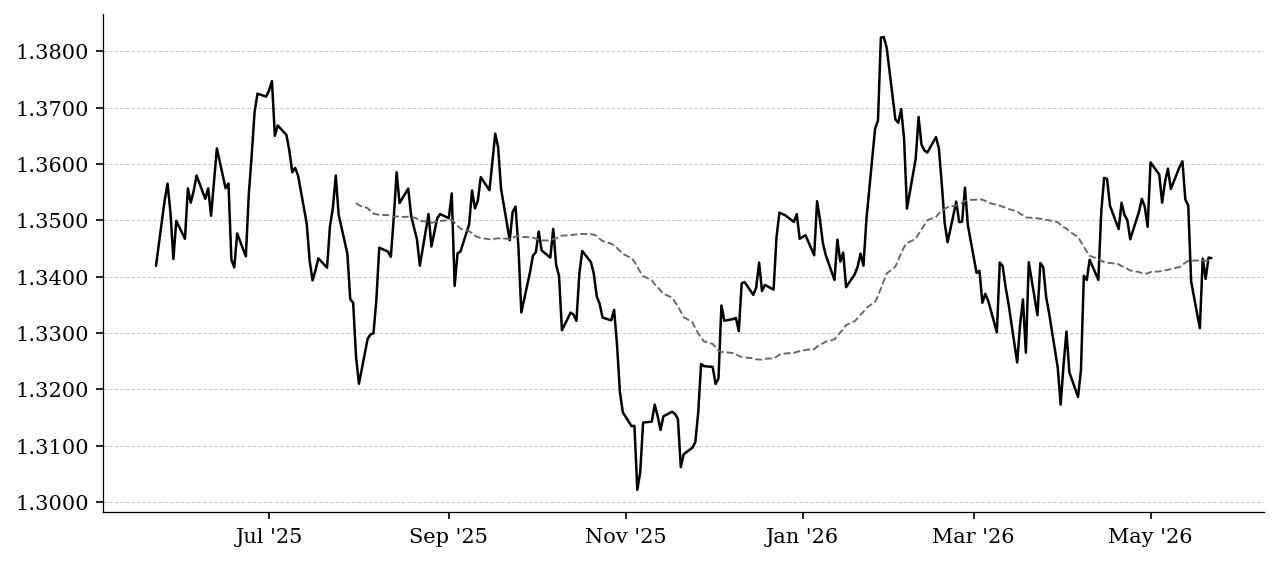
GBP/USD
GBPUSD=X
· YAHOO
· Daily
| Current |
1 Day |
1 Week |
1 Month |
YTD |
| 1.3433 |
-0.0% |
+0.3% |
-0.5% |
-0.3% |
As of May 22, 2026
Exchange rate between the British pound and U.S. dollar.
Reflects UK-specific economic conditions and policy relative to the U.S., with sensitivity to global risk sentiment.
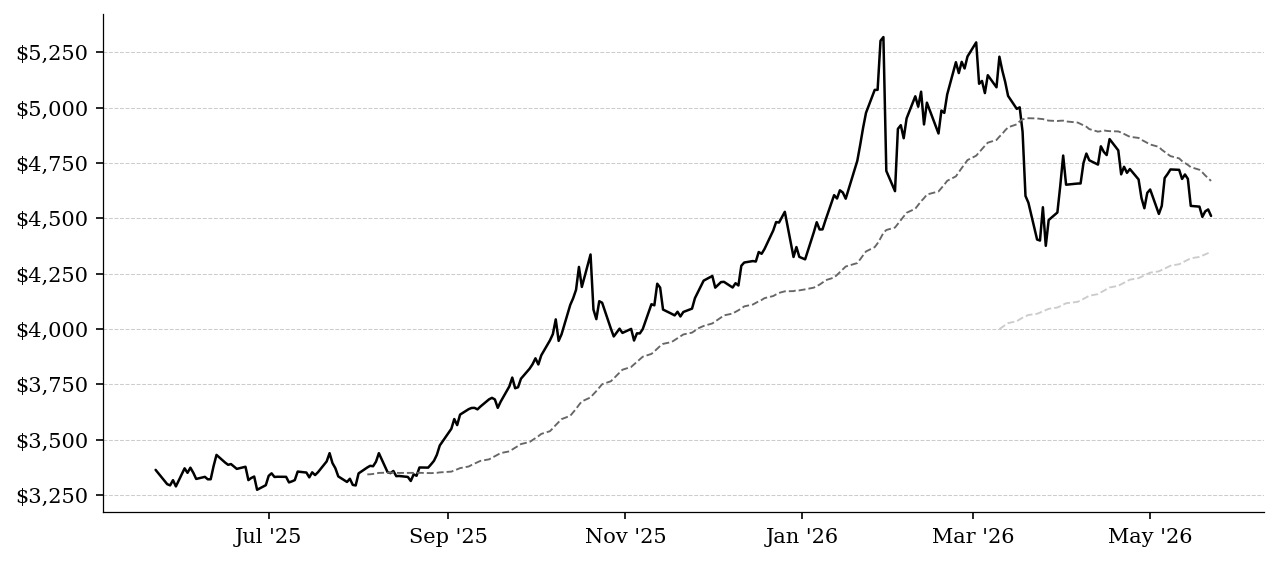
Gold
GC=F
· YAHOO
· Daily
| Current |
1 Day |
1 Week |
1 Month |
YTD |
| $4,510.50 |
$-29.30 (-0.6%) |
$-45.30 (-1.0%) |
$-194.60 (-4.1%) |
+$196.10 (+4.5%) |
As of May 22, 2026
Precious metal used as a store of value.
Typically rises during periods of declining real rates, inflation concerns, or geopolitical risk, serving as a hedge against monetary instability.
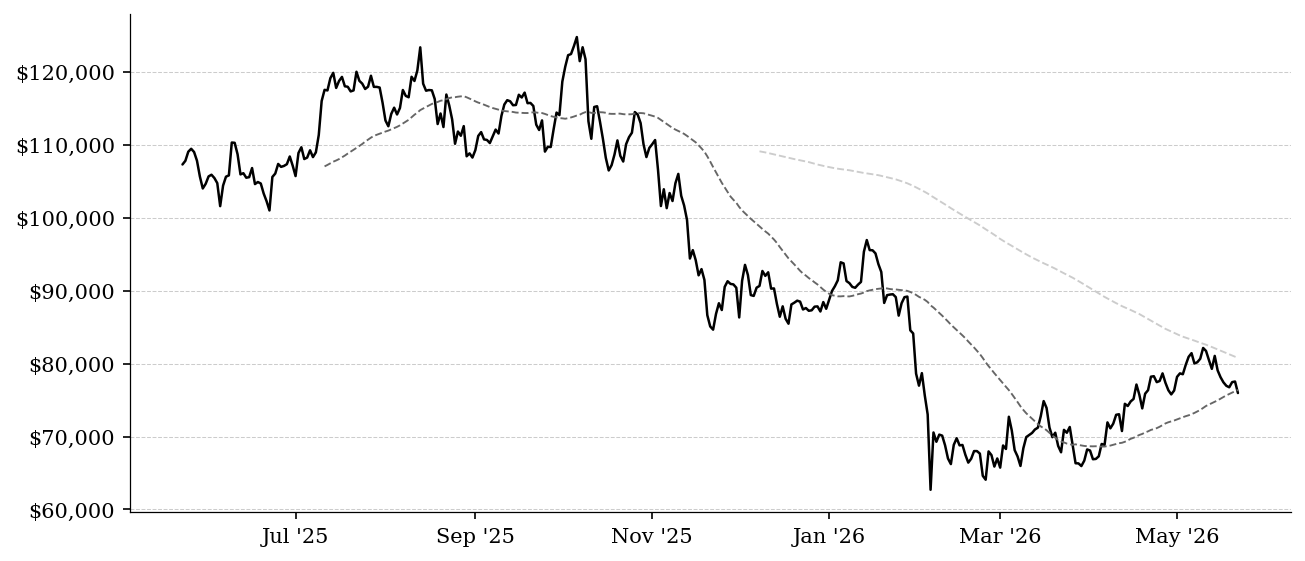
Bitcoin
BTC-USD
· YAHOO
· Daily
| Current |
1 Day |
1 Week |
1 Month |
YTD |
| $75,962.48 |
$-1,576.70 (-2.0%) |
$-1,466.88 (-1.9%) |
$-2,216.52 (-2.8%) |
$-12,769.51 (-14.4%) |
As of May 22, 2026
Digital asset often viewed as a speculative or alternative store of value.
Highly sensitive to liquidity and risk appetite; strong performance often coincides with easy financial conditions and speculative behavior.
Commodities
Crude Oil (WTI)
CL=F
· YAHOO
· Daily
| Current |
1 Day |
1 Week |
1 Month |
YTD |
| $97.00 |
+$0.65 (+0.7%) |
$-8.42 (-8.0%) |
+$1.15 (+1.2%) |
+$39.68 (+69.2%) |
As of May 22, 2026
Benchmark price for U.S. crude oil.
Rising oil prices can signal strong demand or supply constraints and tend to be inflationary, while falling prices often indicate weakening global growth.
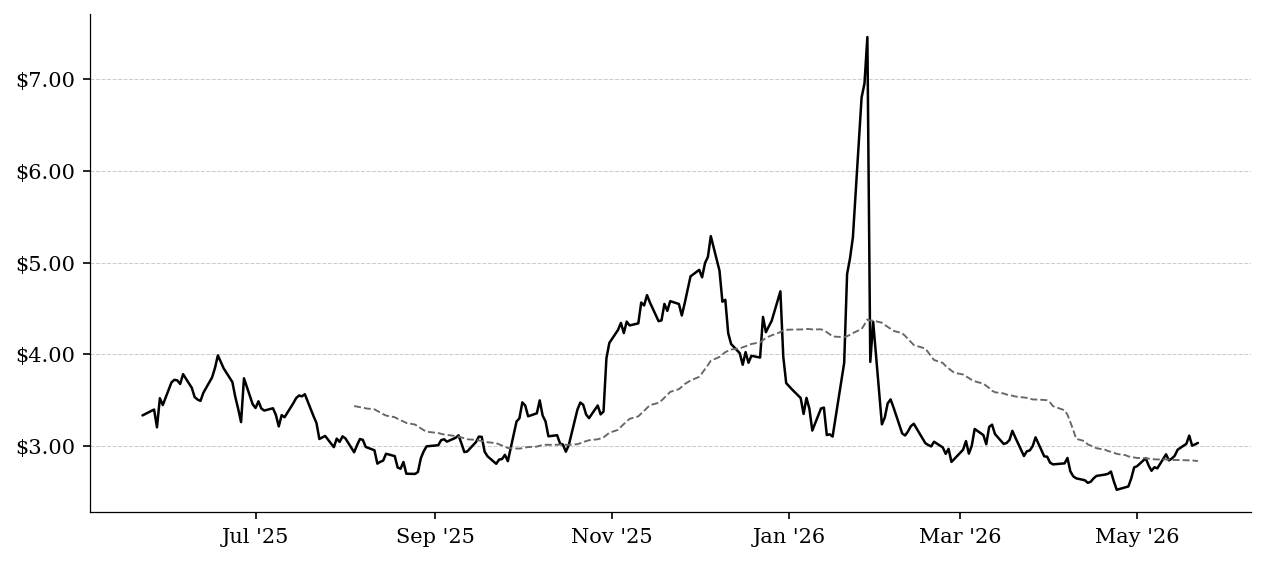
Natural Gas
NG=F
· YAHOO
· Daily
| Current |
1 Day |
1 Week |
1 Month |
YTD |
| $3.03 |
+$0.02 (+0.5%) |
+$0.07 (+2.5%) |
+$0.42 (+16.1%) |
$-0.58 (-16.1%) |
As of May 22, 2026
Price of natural gas, a key energy input.
Often more supply-driven but still relevant for inflation and industrial activity, particularly in energy-sensitive regions.
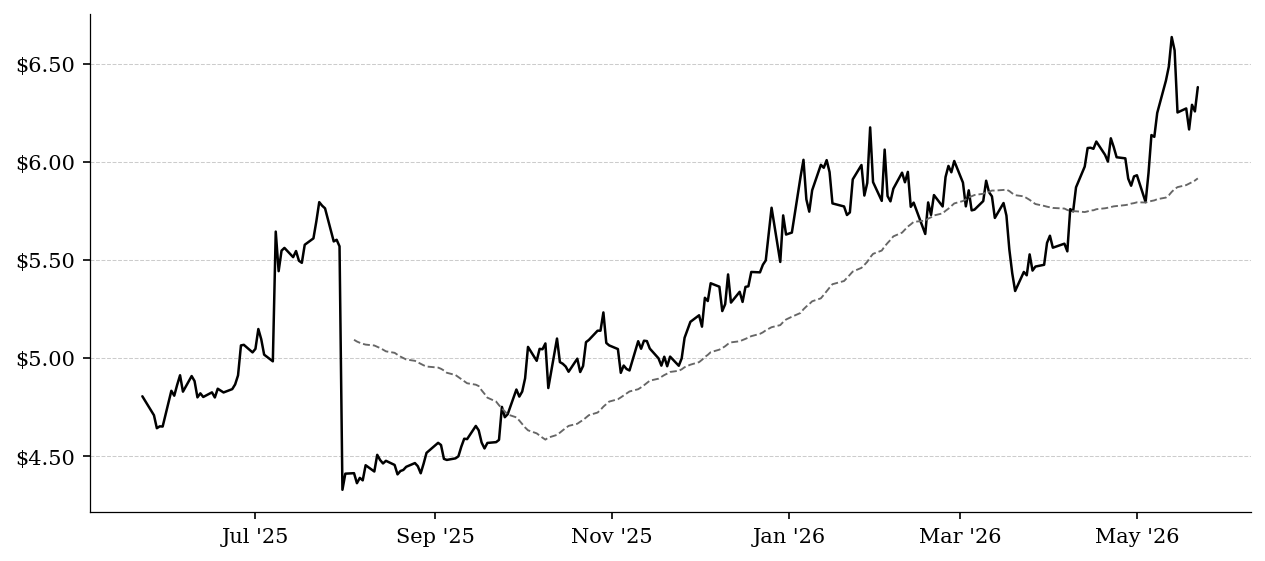
Copper
HG=F
· YAHOO
· Daily
| Current |
1 Day |
1 Week |
1 Month |
YTD |
| $6.38 |
+$0.12 (+2.0%) |
+$0.13 (+2.1%) |
+$0.30 (+5.0%) |
+$0.74 (+13.1%) |
As of May 22, 2026
Industrial metal widely used in construction and manufacturing.
Often called "Dr. Copper," it is a leading indicator of global economic activity, with rising prices signaling growth and falling prices indicating slowdown.
Silver
SI=F
· YAHOO
· Daily
| Current |
1 Day |
1 Week |
1 Month |
YTD |
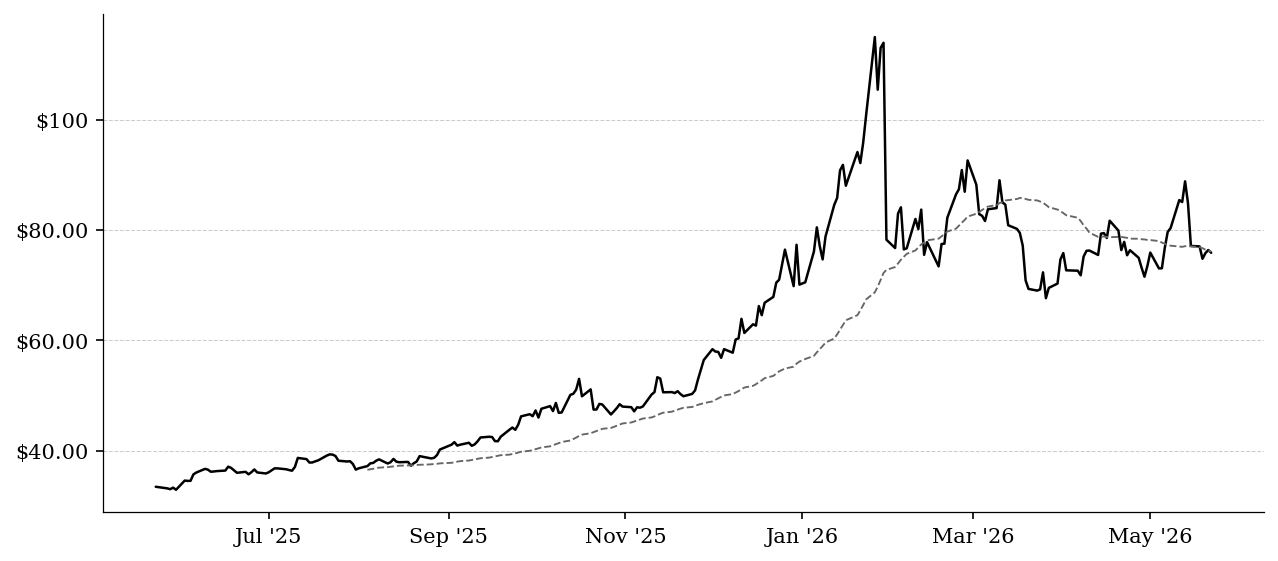
| $75.92 |
$-0.50 (-0.7%) |
$-1.25 (-1.6%) |
+$0.45 (+0.6%) |
+$5.36 (+7.6%) |
As of May 22, 2026
Silver futures. Industrial metal and precious metal hybrid.
Dual nature: industrial demand (solar, electronics) and safe-haven store of value. Outperforming gold = industrial optimism. Underperforming = pure fear bid favoring gold.
Soybeans
ZS=F
· YAHOO
· Daily
| Current |
1 Day |
1 Week |
1 Month |
YTD |
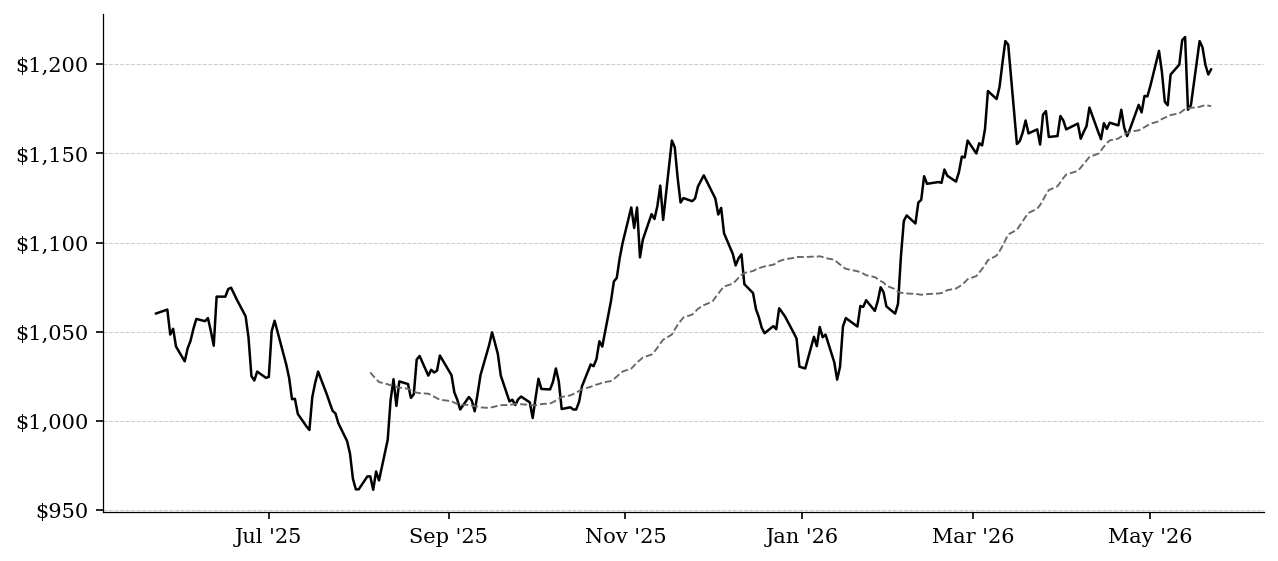
| $1,197.25 |
+$3.00 (+0.3%) |
+$20.25 (+1.7%) |
+$37.50 (+3.2%) |
+$167.75 (+16.3%) |
As of May 22, 2026
Soybean futures. Agricultural bellwether and food inflation proxy.
Key input for animal feed and cooking oil. Rising = food inflation pressure, supply disruption (weather, trade policy). Falling = bumper crops or demand destruction.
Wheat
ZW=F
· YAHOO
· Daily
| Current |
1 Day |
1 Week |
1 Month |
YTD |
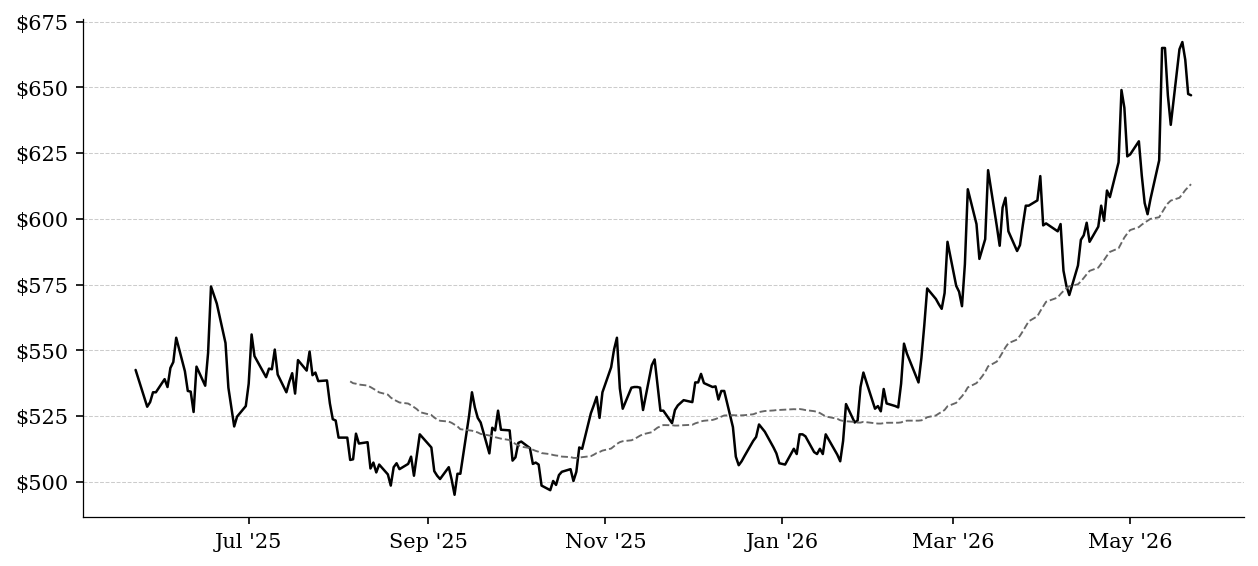
| $647.00 |
$-0.50 (-0.1%) |
+$11.25 (+1.8%) |
+$36.25 (+5.9%) |
+$140.50 (+27.7%) |
As of May 22, 2026
Wheat futures. Global food security and geopolitical risk indicator.
Staple food commodity sensitive to weather, war, and trade restrictions. Spikes signal food inflation risk and geopolitical supply disruption.
Institutional Flows
Fed Balance Sheet Total Assets
WALCL
· FRED
· Weekly
| Current |
1 Day |
1 Week |
1 Month |
YTD |
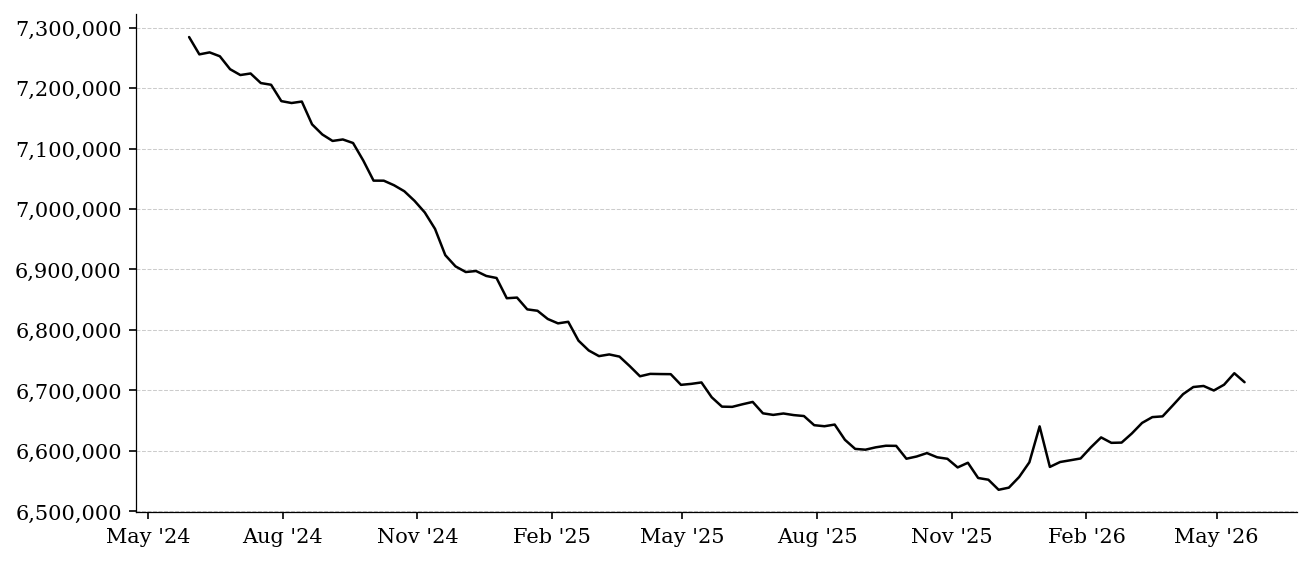
| 6,713,643.00 |
-0.2% |
+0.1% |
+2.0% |
+2.1% |
As of May 20, 2026
Federal Reserve total assets in millions. Proxy for liquidity injections.
Rising = Fed expanding balance sheet, adding liquidity, supportive for risk assets. Falling = quantitative tightening, draining liquidity, headwind for all asset prices.
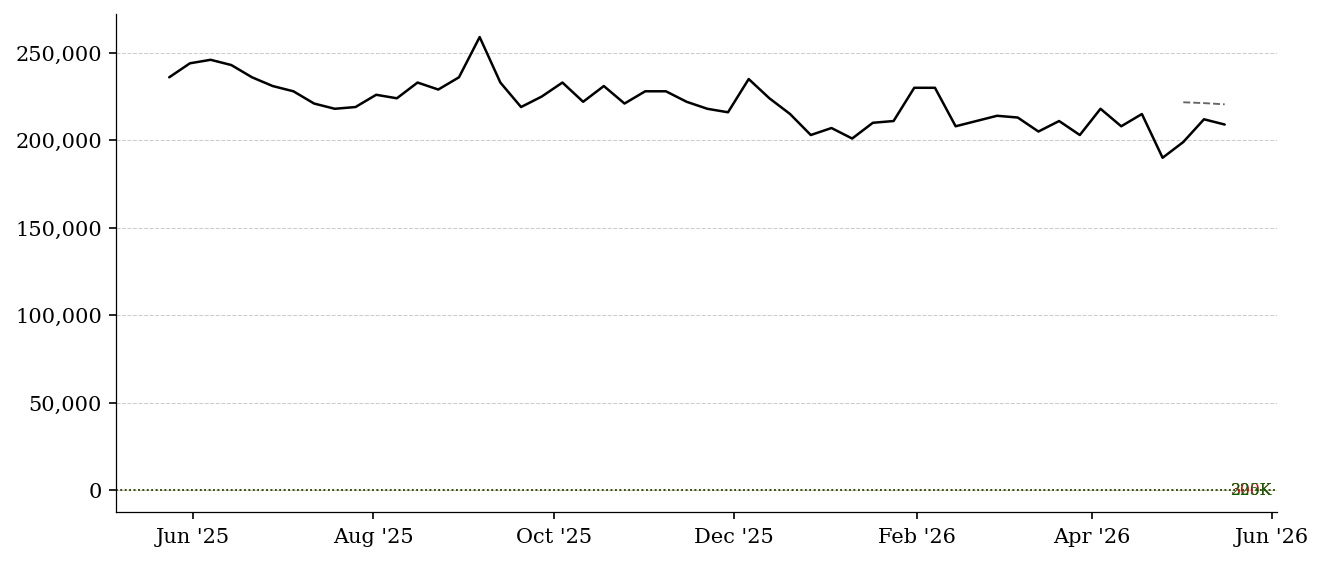
Initial Jobless Claims
ICSA
· FRED
· Weekly
| Current |
1 Day |
1 Week |
1 Month |
YTD |
| 209,000.00 |
-1.4% |
+0.5% |
-2.8% |
+1.0% |
As of May 16, 2026
Weekly new unemployment insurance claims in thousands.
The fastest labor market pulse. Below 225K = tight labor market. Rising trend above 300K = layoffs accelerating, recession risk climbing.
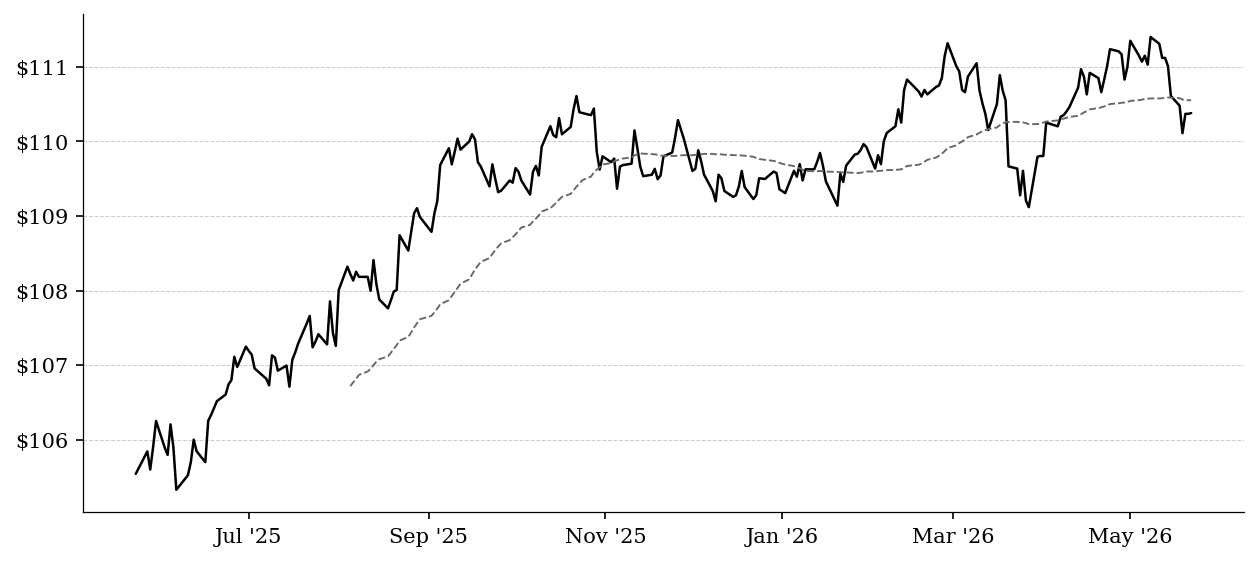
iShares TIPS Bond ETF
TIP
· YAHOO
· Daily
| Current |
1 Day |
1 Week |
1 Month |
YTD |
| $110.38 |
+$0.01 (+0.0%) |
$-0.23 (-0.2%) |
$-0.63 (-0.6%) |
+$1.07 (+1.0%) |
As of May 22, 2026
TIPS ETF. Proxy for inflation protection demand.
Rising = investors buying inflation protection, real yields falling. Falling = inflation fears fading or real yields rising and punishing duration.
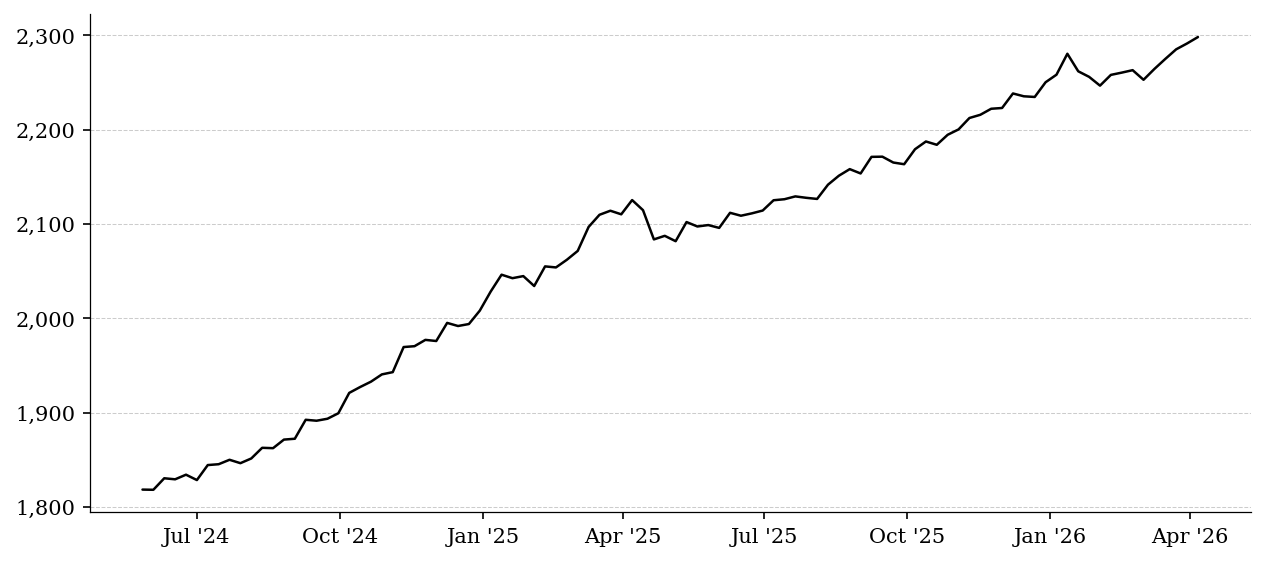
Retail Money Market Funds
WRMFNS
· FRED
· Weekly
| Current |
1 Day |
1 Week |
1 Month |
YTD |
| 2,298.20 |
+0.3% |
+2.0% |
+3.9% |
+1.8% |
As of April 6, 2026
Retail money market fund assets in billions. Cash on the sidelines.
Record highs = massive cash parked defensively, potential fuel for future equity rally. Falling = money moving out of cash into risk assets, bullish rotation underway.
Real Estate Proxies
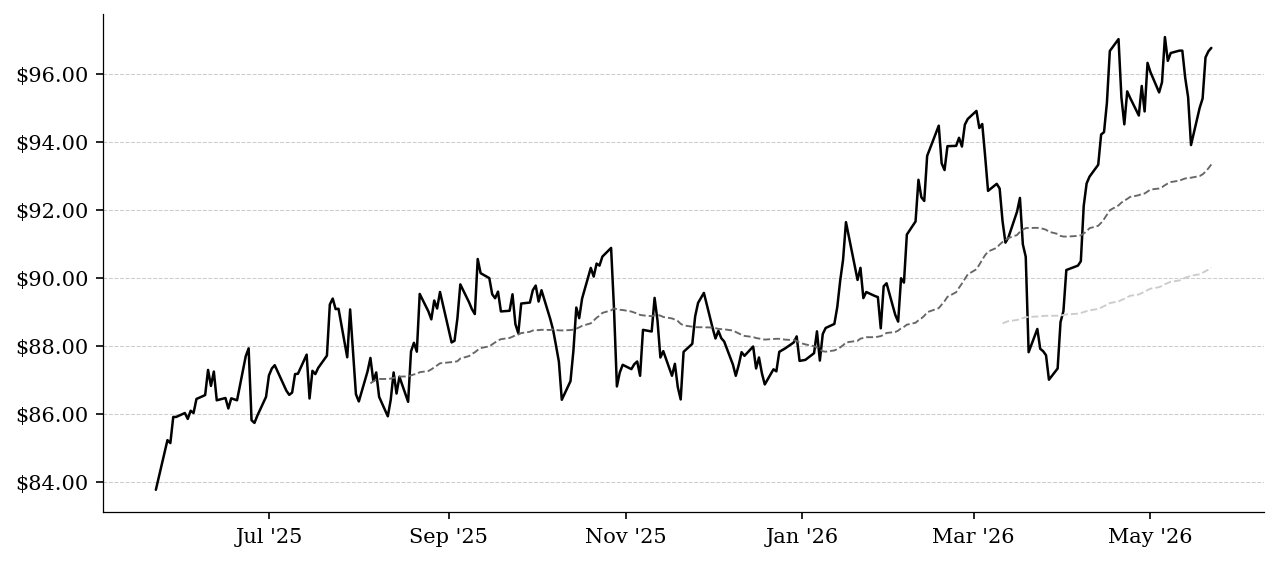
Vanguard Real Estate ETF
VNQ
· YAHOO
· Daily
| Current |
1 Day |
1 Week |
1 Month |
YTD |
| $96.77 |
+$0.10 (+0.1%) |
+$2.86 (+3.0%) |
+$1.28 (+1.3%) |
+$9.19 (+10.5%) |
As of May 22, 2026
ETF tracking publicly traded U.S. real estate investment trusts.
Reflects the impact of rates and economic conditions on real estate valuations, often acting as a liquid proxy for private market trends.
SPDR Homebuilders ETF
XHB
· YAHOO
· Daily
| Current |
1 Day |
1 Week |
1 Month |
YTD |
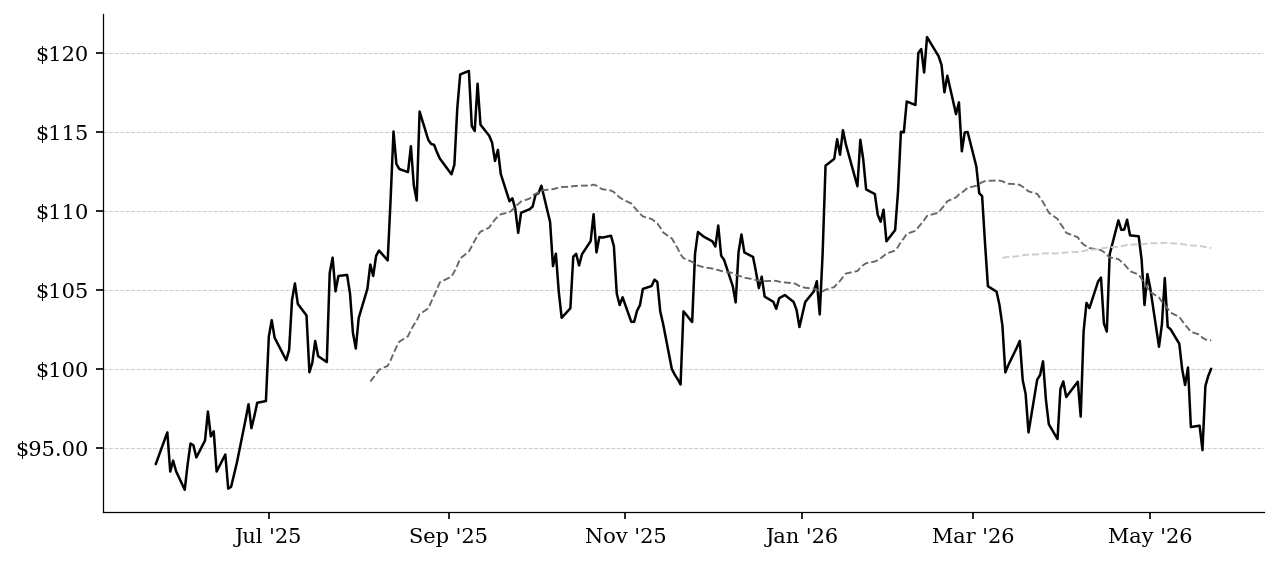
| $100.01 |
+$0.45 (+0.5%) |
+$3.69 (+3.8%) |
$-9.43 (-8.6%) |
$-4.22 (-4.1%) |
As of May 22, 2026
ETF tracking U.S. homebuilding companies.
Highly sensitive to mortgage rates and housing demand, providing a forward-looking view on residential real estate activity.
iShares MBS ETF
MBB
· YAHOO
· Daily
| Current |
1 Day |
1 Week |
1 Month |
YTD |
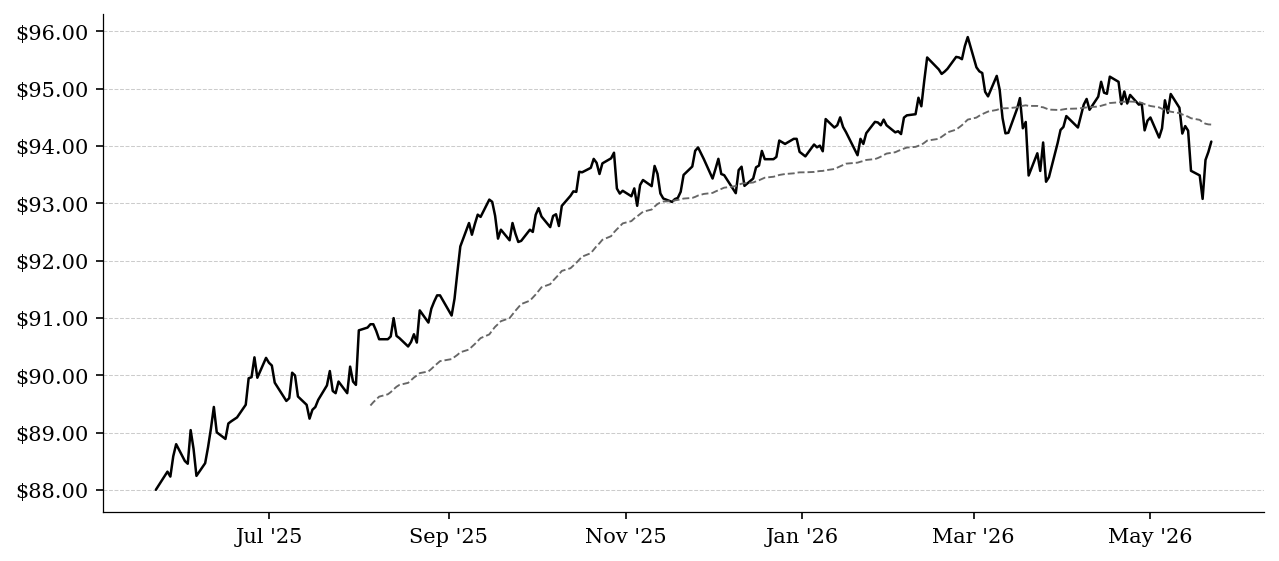
| $94.08 |
+$0.18 (+0.2%) |
+$0.51 (+0.5%) |
$-0.66 (-0.7%) |
+$0.26 (+0.3%) |
As of May 22, 2026
ETF representing mortgage-backed securities.
Reflects conditions in mortgage financing markets; weakness often indicates widening spreads and tighter housing finance conditions.
30Y Fixed Mortgage Rate
MORTGAGE30US
· FRED
· Weekly
| Current |
1 Day |
1 Week |
1 Month |
YTD |
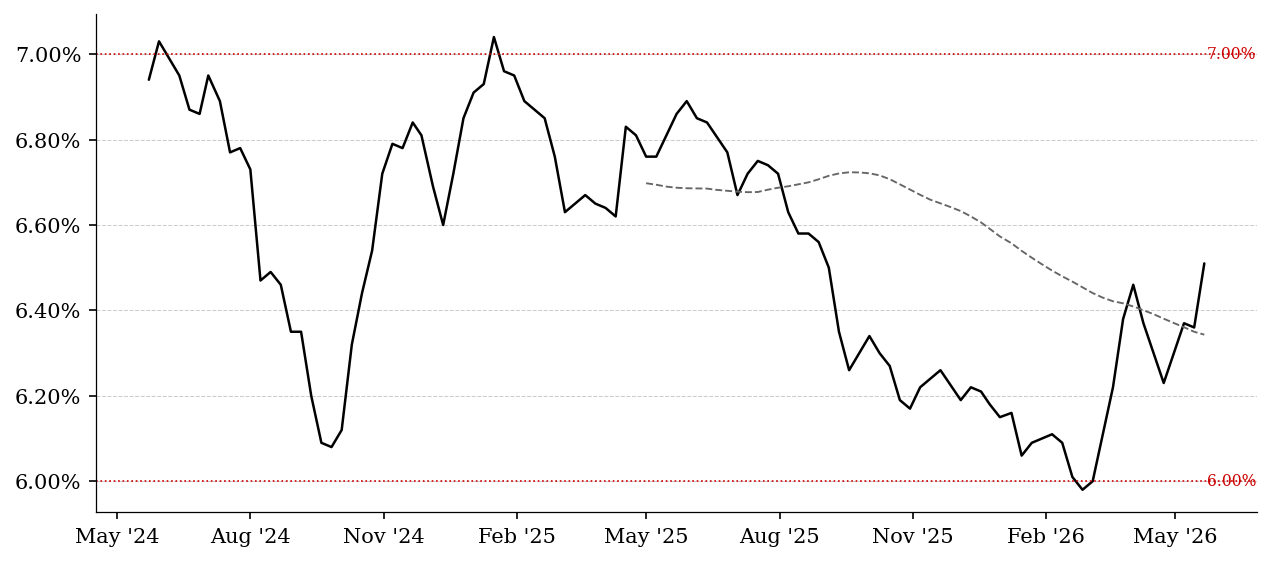
| 6.51% |
+2.4% |
+3.3% |
+5.3% |
+5.7% |
As of May 21, 2026
Freddie Mac 30-year fixed-rate mortgage average.
The rate that drives housing affordability. Above 7% = demand destruction. Below 6% = refis restart and buyers return. Every 1% move reprices monthly payments ~10%.
Housing Starts
HOUST
· FRED
· Monthly
| Current |
1 Day |
1 Week |
1 Month |
YTD |
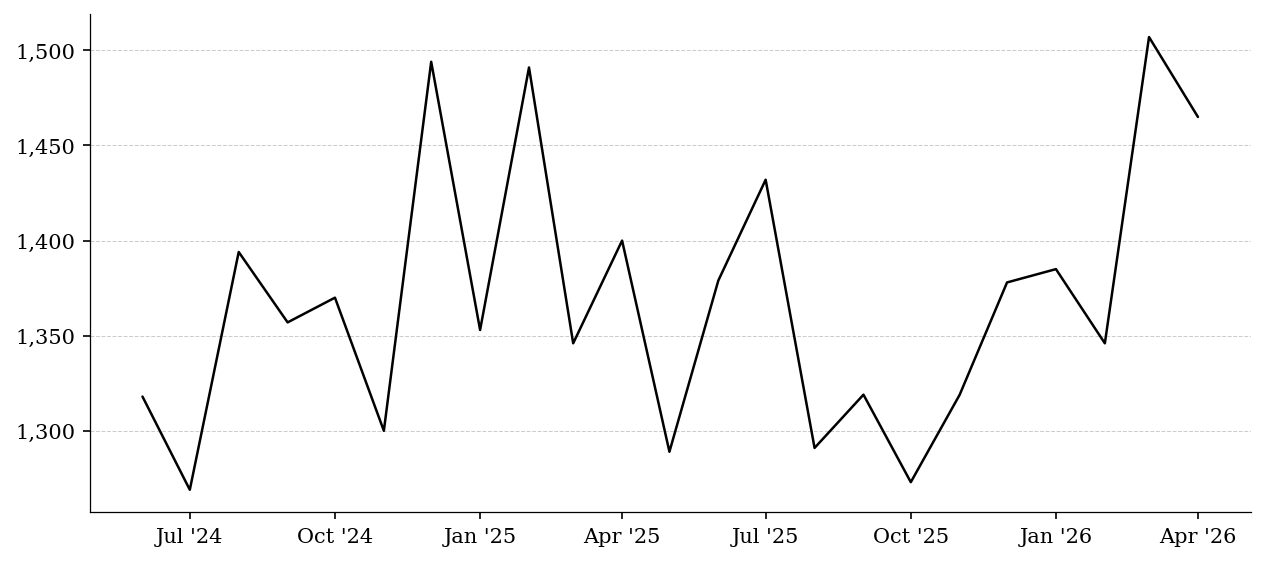
| 1,465.00 |
-2.8% |
+11.1% |
+15.4% |
+5.8% |
As of April 1, 2026
New residential construction starts in thousands of units.
Leading indicator of housing supply and builder confidence. Rising = builders see demand. Falling = rates or costs choking new construction.
Existing Home Sales
EXHOSLUSM495S
· FRED
· Monthly
| Current |
1 Day |
1 Week |
1 Month |
YTD |
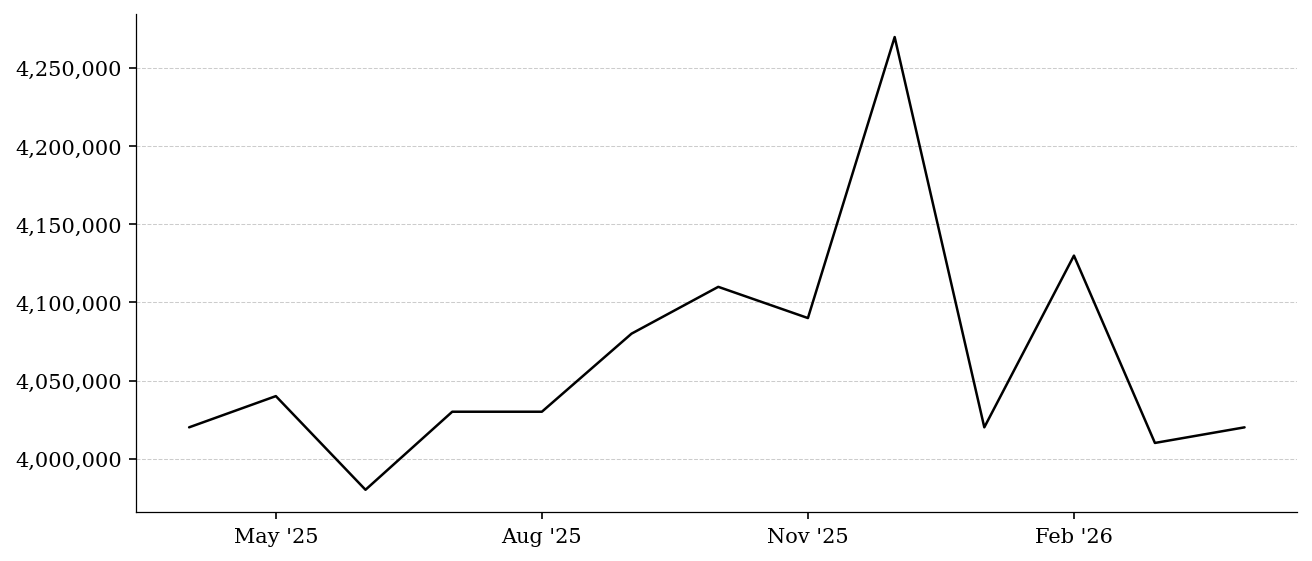
| 4,020,000.00 |
+0.2% |
-1.7% |
N/A |
+0.0% |
As of April 1, 2026
Existing home sales in millions of units annualized.
Volume indicator for the resale market. Falling = lock-in effect as owners hold low-rate mortgages. Rising = rate relief thawing the frozen housing market.
S&P/Case-Shiller Home Price Index
CSUSHPINSA
· FRED
· Monthly
| Current |
1 Day |
1 Week |
1 Month |
YTD |
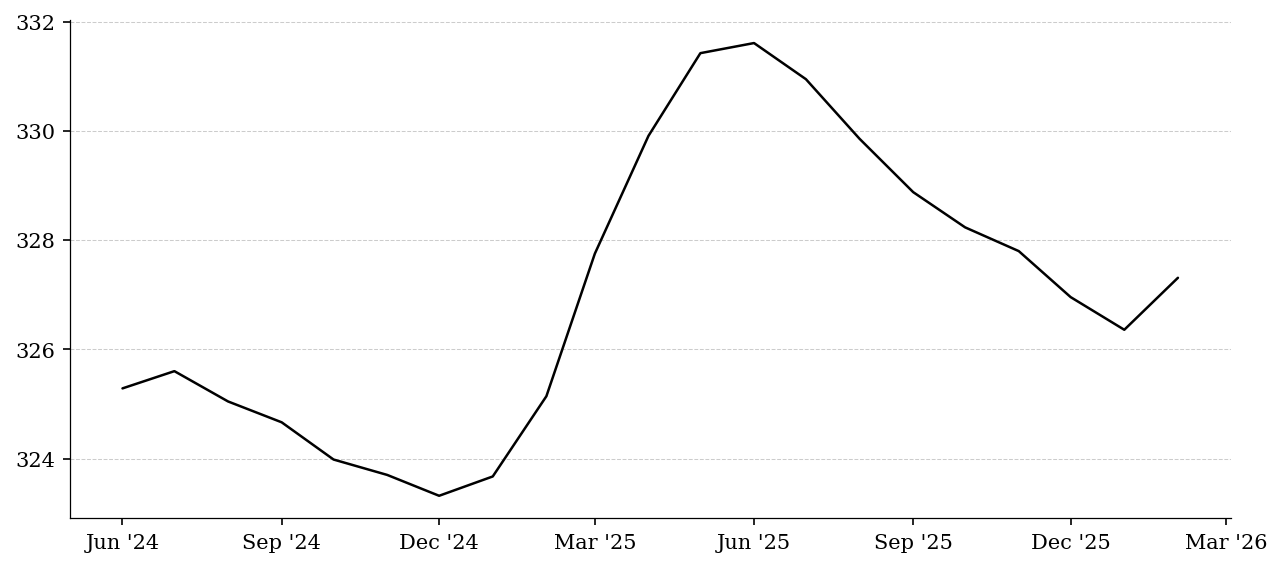
| 327.31 |
+0.3% |
-0.5% |
+1.1% |
+0.3% |
As of February 1, 2026
National home price index. The definitive measure of US house prices.
The gold standard for home price trends. Rising = wealth effect for homeowners, affordability squeeze for buyers. Falling = negative equity risk, consumer retrenchment.
Building Permits
PERMIT
· FRED
· Monthly
| Current |
1 Day |
1 Week |
1 Month |
YTD |
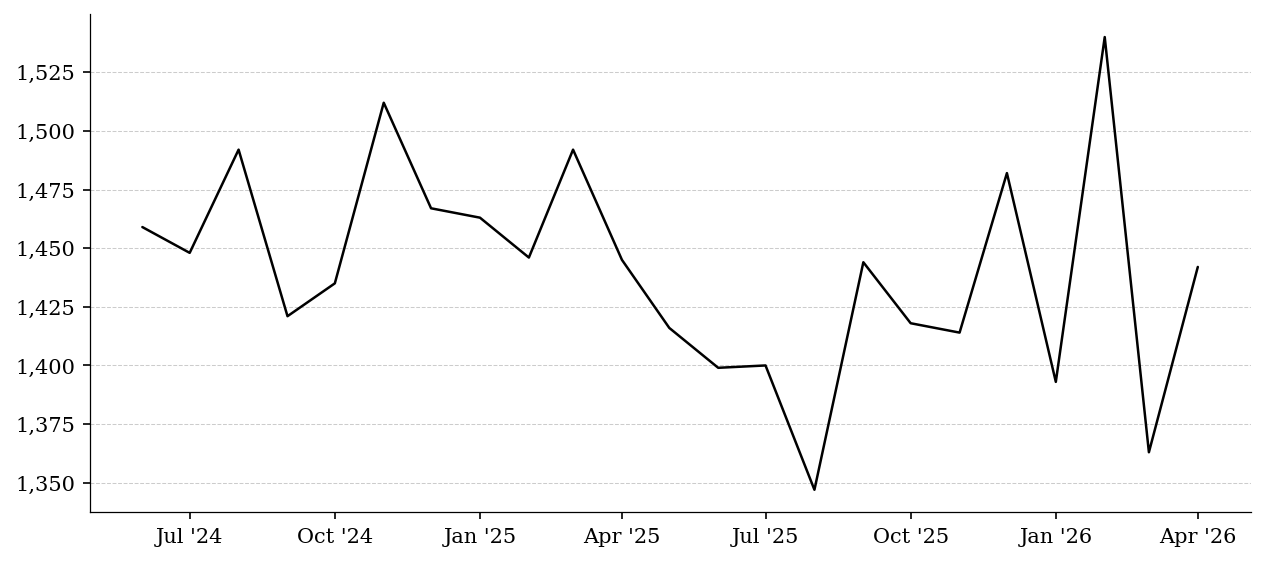
| 1,442.00 |
+5.8% |
+2.0% |
-0.4% |
+3.5% |
As of April 1, 2026
New privately-owned housing units authorized in thousands.
Leading indicator — permits precede starts by 1-2 months. Rising = pipeline building, builder optimism. Falling = future supply contraction ahead.
Private Credit
Senior Loans / Leveraged Loans (BKLN)
BKLN
· YAHOO
· Daily
| Current |
1 Day |
1 Week |
1 Month |
YTD |
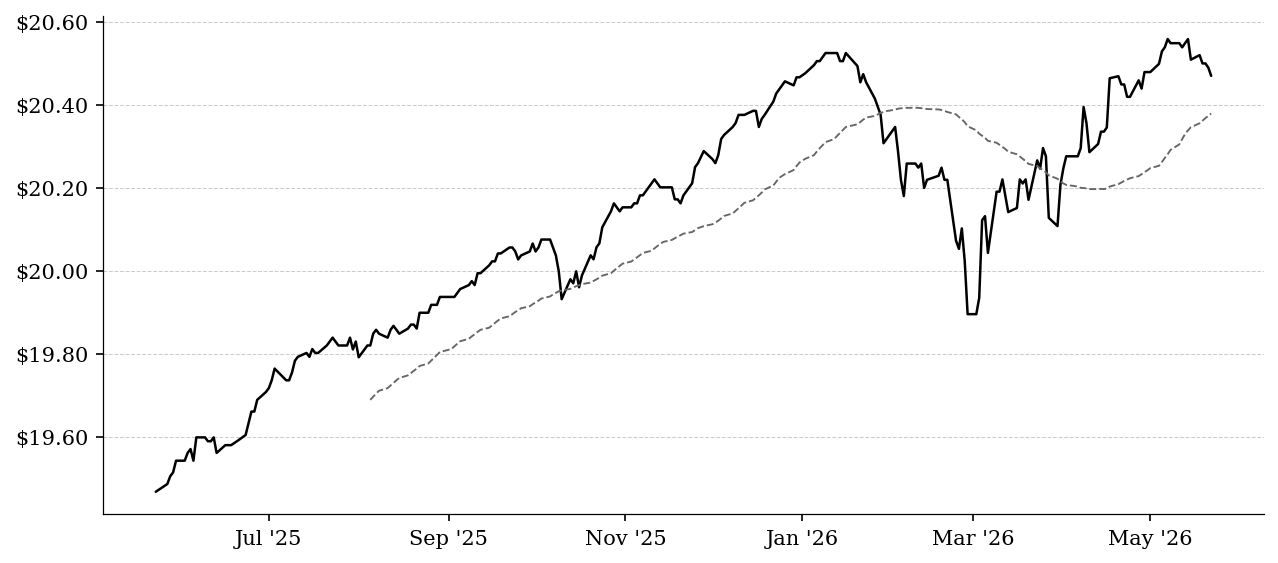
| $20.47 |
$-0.02 (-0.1%) |
$-0.04 (-0.2%) |
+$0.05 (+0.2%) |
$-0.01 (-0.0%) |
As of May 22, 2026
Tracks leveraged loans (floating-rate senior secured). Core of private credit collateral.
The canary in private credit. Falling prices = stress in leveraged borrowers and CLOs. Floating-rate means rising rates hit these borrowers first.
Business Development Companies (BIZD)
BIZD
· YAHOO
· Daily
| Current |
1 Day |
1 Week |
1 Month |
YTD |
| $12.38 |
$-0.14 (-1.1%) |
$-0.23 (-1.8%) |
$-0.33 (-2.6%) |
$-1.34 (-9.8%) |
As of May 22, 2026
ETF of publicly traded BDCs — the closest public proxy for private direct lending.
BDCs are the public window into private credit. Falling BIZD = rising defaults or NAV markdowns in direct lending portfolios. Discount to NAV widens when credit stress builds.
Blue Owl Capital Corporation (OBDC)
OBDC
· YAHOO
· Daily
| Current |
1 Day |
1 Week |
1 Month |
YTD |
| $11.03 |
$-0.15 (-1.3%) |
$-0.18 (-1.6%) |
$-0.32 (-2.8%) |
$-1.10 (-9.1%) |
As of May 22, 2026
Largest publicly traded direct lending BDC. Blue Owl's flagship private credit vehicle.
OBDC is the single best public read on private credit health. Price vs NAV discount signals market confidence in direct lending book values. Widening discount = market doubts marks on underlying loans.
Actively Managed Senior Loans (SRLN)
SRLN
· YAHOO
· Daily
| Current |
1 Day |
1 Week |
1 Month |
YTD |
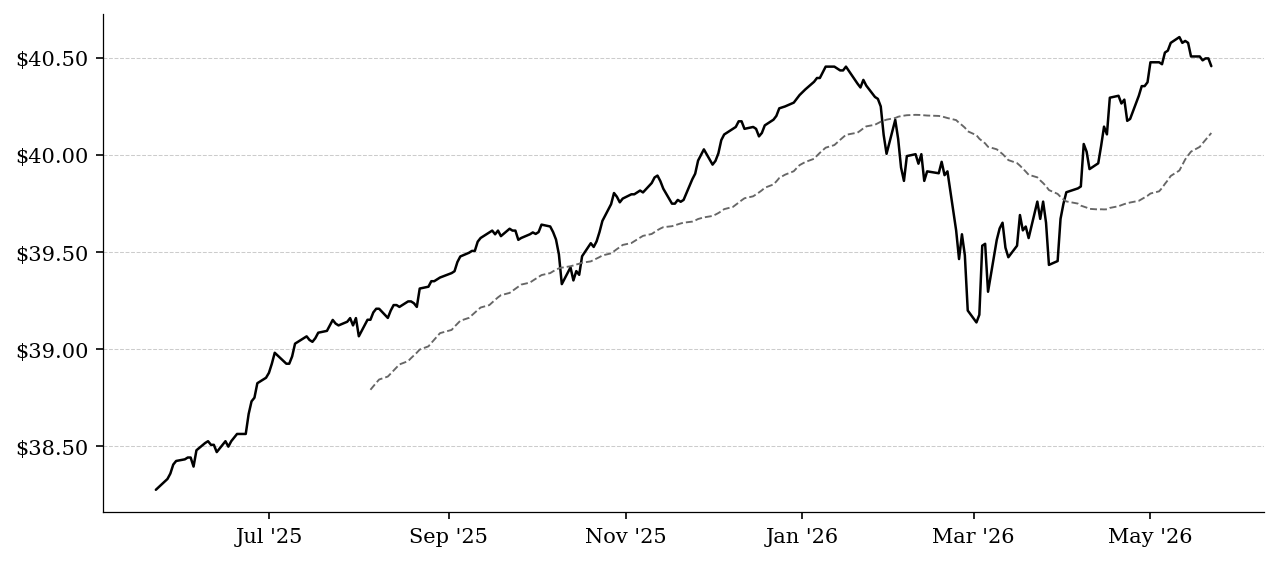
| $40.46 |
$-0.04 (-0.1%) |
$-0.05 (-0.1%) |
+$0.28 (+0.7%) |
+$0.12 (+0.3%) |
As of May 22, 2026
Actively managed leveraged loan fund. Complements BKLN with a manager-selected view.
When SRLN diverges from BKLN, active managers are seeing something passive indexing misses. Watch for widening gap during stress.
HY / IG Spread Proxy (HYG÷LQD)
HYG
· YAHOO
· Daily
| Current |
1 Day |
1 Week |
1 Month |
YTD |
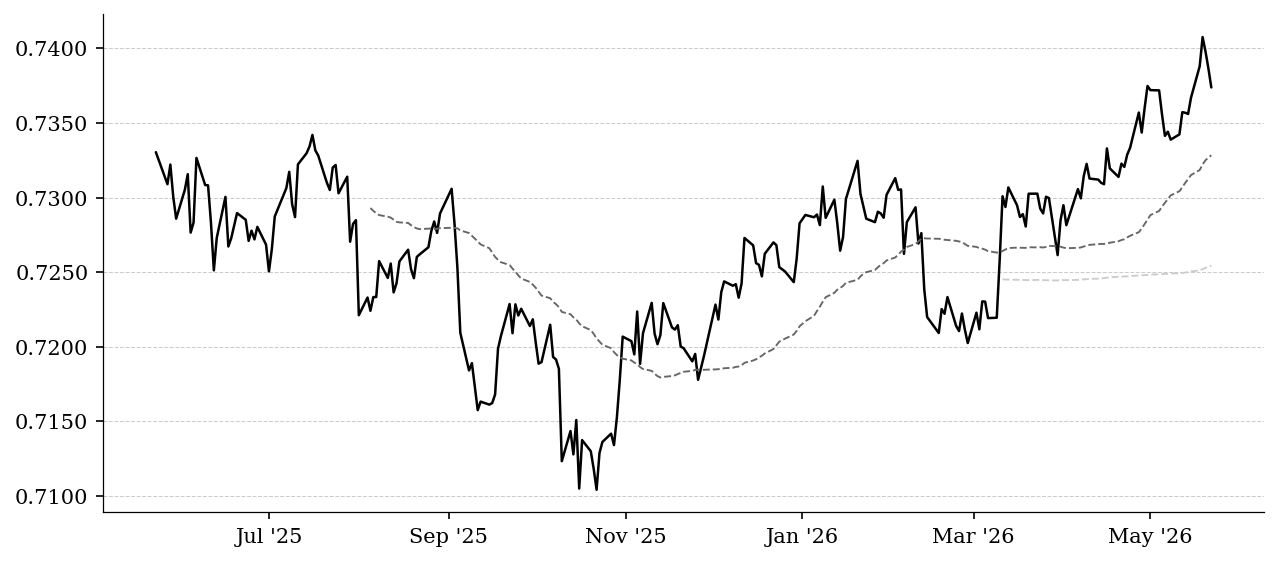
| 0.7374 |
-0.2% |
+0.1% |
+0.6% |
+1.2% |
As of May 22, 2026
Ratio of high-yield to investment-grade bond ETFs. Proxy for credit spread direction.
Rising ratio = credit spreads tightening, risk appetite healthy. Falling ratio = spreads widening, stress migrating from junk toward quality.
56 Maple is a Chicago-based family office and investment platform focused on long-term capital deployment across real estate, private operating companies, as well as sponsor-led transactions. Rooted in a multigenerational real estate background, the firm partners with operators and sponsors to invest in cash-flowing assets and businesses with strong fundamentals. 56 Maple emphasizes disciplined underwriting, aligned incentives, and a long-term ownership mindset.